Network distance
The following is an example of how to calculate network distance in python. I used the following sites as resources to create this: - https://networkx.github.io/documentation/stable/ - https://automating-gis-processes.github.io/2017/lessons/L7/network-analysis.html
These are the python libraries I will use
[1]:
import geopandas as gpd
import pandas as pd
import matplotlib.pyplot as plt
import osmnx as ox
import networkx as nx
from shapely.geometry import box, LineString, Point,MultiPoint
import pyproj
import os
import sys
sys.path.append(os.path.realpath('..'))
Open Street Map
We pull in data from Open Street Map
Specify that that we will be calculating walking distances
[2]:
place_name = "New York City, NY, United States of America"
graph = ox.graph_from_place(place_name, network_type='walk')
[199]:
fig, ax = ox.plot_graph(graph, fig_height=12)
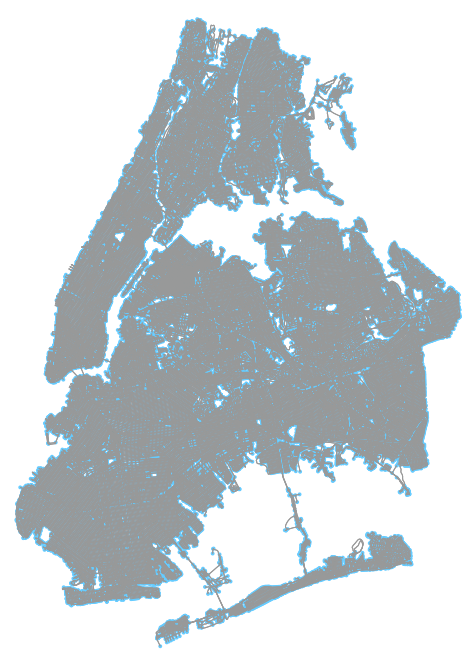
From the graph, we will extract the nodes and the edges(lines) into geopandas dataframes
[101]:
nodes, edges = ox.graph_to_gdfs(graph, nodes=True, edges=True)
Check the crs of each of them
[102]:
nodes.crs
[102]:
{'init': 'epsg:4326'}
[196]:
edges.crs
[196]:
{'init': 'epsg:4326'}
Obtain some statistics about the graph we had extracted
[197]:
stats = ox.basic_stats(graph)
stats
[197]:
{'n': 102520,
 'm': 319636,
 'k_avg': 6.235583300819353,
 'intersection_count': 89591,
 'streets_per_node_avg': 3.119761997658993,
 'streets_per_node_counts': {0: 0,
  1: 12929,
  2: 3,
  3: 52635,
  4: 35920,
  5: 889,
  6: 136,
  7: 7,
  8: 1},
 'streets_per_node_proportion': {0: 0.0,
  1: 0.12611197815060476,
  2: 2.926258291065158e-05,
  3: 0.5134120171673819,
  4: 0.3503706593835349,
  5: 0.008671478735856419,
  6: 0.0013265704252828716,
  7: 6.827936012485369e-05,
  8: 9.754194303550527e-06},
 'edge_length_total': 24370226.77800066,
 'edge_length_avg': 76.24368587393366,
 'street_length_total': 12266411.895000145,
 'street_length_avg': 76.47770396902679,
 'street_segments_count': 160392,
 'node_density_km': None,
 'intersection_density_km': None,
 'edge_density_km': None,
 'street_density_km': None,
 'circuity_avg': 1.0425264395549814,
 'self_loop_proportion': 0.0035915854284248334,
 'clean_intersection_count': None,
 'clean_intersection_density_km': None}
Test case
We will use two points that are across from each other, but has a highway between them. The network analysis route should move along the road until it find a road that can cross under the highway.
To see the points: Destination point: https://www.google.com/maps/place/40%C2%B044’13.9%22N+73%C2%B051’50.6%22W/@40.737199,-73.8662467,17z/data=!3m1!4b1!4m5!3m4!1s0x0:0x0!8m2!3d40.737199!4d-73.864058
Origin point: https://www.google.com/maps/place/40%C2%B043’56.9%22N+73%C2%B051’42.0%22W/@40.732484,-73.8638547,17z/data=!3m1!4b1!4m5!3m4!1s0x0:0x0!8m2!3d40.732484!4d-73.861666
[118]:
target_xy = (40.737199,-73.864058)
orig_xy = (40.732484,-73.861666)
For the origin/destination point, we will find the nearest node.
[119]:
orig_node = ox.get_nearest_node(graph, orig_xy, method='euclidean')
target_node = ox.get_nearest_node(graph, target_xy, method='euclidean')
o_closest = nodes.loc[orig_node]
t_closest = nodes.loc[target_node]
[120]:
print("o_closest", o_closest)
print("t_closest", t_closest)
o_closest highway                  traffic_signals
osmid                           42814128
ref                                  NaN
x                               -73.8617
y                                40.7325
geometry    POINT (-73.861666 40.732473)
Name: 42814128, dtype: object
t_closest highway                   traffic_signals
osmid                          3614573766
ref                                   NaN
x                                 -73.864
y                                 40.7372
geometry    POINT (-73.8640431 40.737171)
Name: 3614573766, dtype: object
[160]:
route = nx.shortest_path(G=graph, source=orig_node, target=target_node, weight=None)
[198]:
fig, ax = ox.plot_graph_route(graph, route, origin_point=orig_xy, destination_point=target_xy, fig_height=12)
plt.tight_layout();
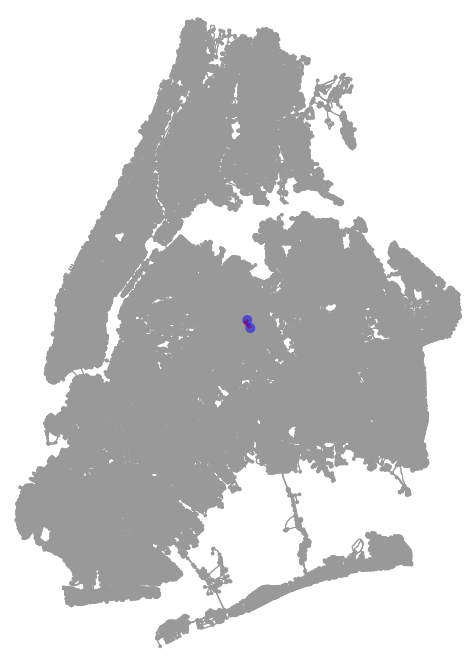
<Figure size 432x288 with 0 Axes>
Capture the route nodes and turn it into a LineString
[161]:
route_nodes = nodes.loc[route]
[163]:
route_line = LineString(list(route_nodes.geometry.values))
Make a geodataframe to store the data
[184]:
route_geom = gpd.GeoDataFrame(crs=edges.crs)
route_geom['geometry'] = None
route_geom['osmids'] = None
Add the information into the geodataframe
[185]:
route_geom.loc[0, 'geometry'] = route_line
[186]:
route_geom.loc[0, 'osmids'] = str(list(route_nodes['osmid'].values))
Now is the time to convert the data into epsg 2263.
[187]:
route_geom.crs
[187]:
{'init': 'epsg:4326'}
[188]:
route_geom = route_geom.to_crs({'init': 'epsg:2263'})
Calculate route length
[189]:
route_geom['length_ft'] = route_geom.length
[190]:
route_geom['length_miles'] = route_geom['length_ft'] *0.000189394
[191]:
route_geom['length_miles'].head()
[191]:
0    0.546331
Name: length_miles, dtype: float64
[192]:
route_geom['id'] = route_geom.index
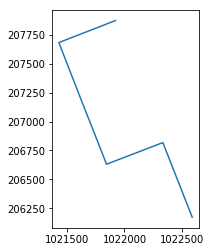
View the route!
[193]:
route_geom.plot()
[193]:
<matplotlib.axes._subplots.AxesSubplot at 0x1c14fb47828>
[194]:
route_geom.head()
[194]:
| geometry | osmids | length_ft | length_miles | id | |
|---|---|---|---|---|---|
| 0 | LINESTRING (1022588.666680825 206166.516154735... | [42814128, 5572315119, 5487756539, 42814124, 3... | 2884.624747 | 0.546331 | 0 |
[195]:
fp =  r"intermediate_data\test_route_shapefile.shp"
route_geom[['id','geometry']].to_file(fp)
[42]:
os.getcwd()
[42]:
'H:\\Personal\\Network distance'