1. Introduction

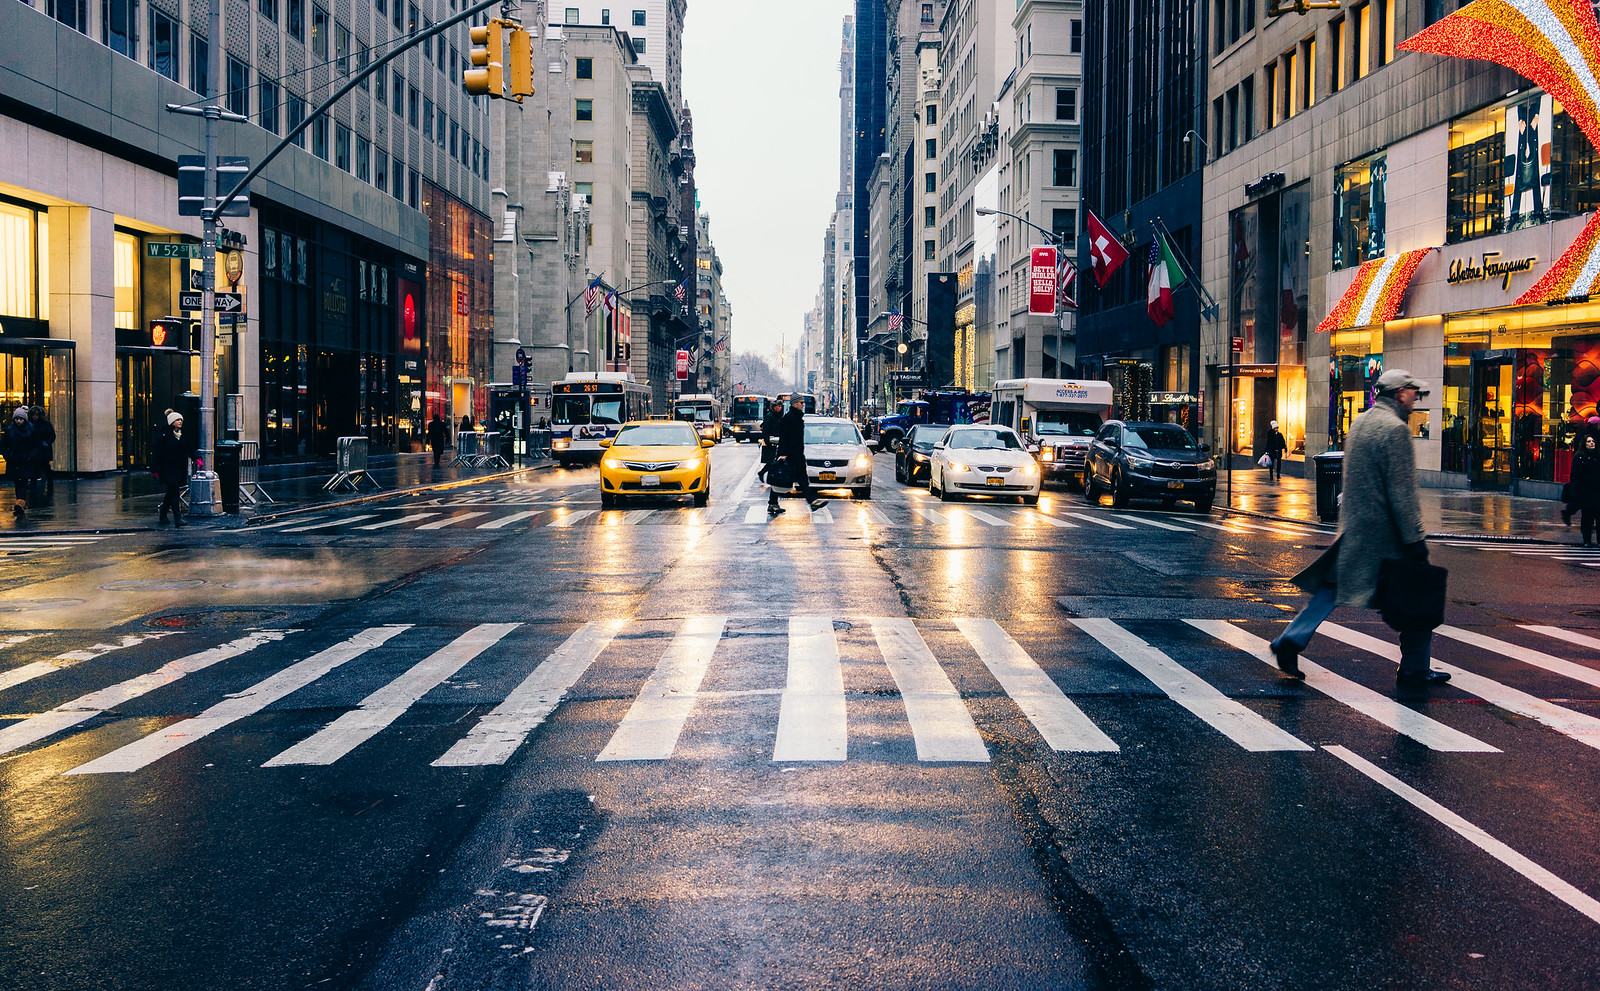 Source: https://www.flickr.com/photos/romankphoto/
Leading Pedestrian Interval Signals (LPIs)
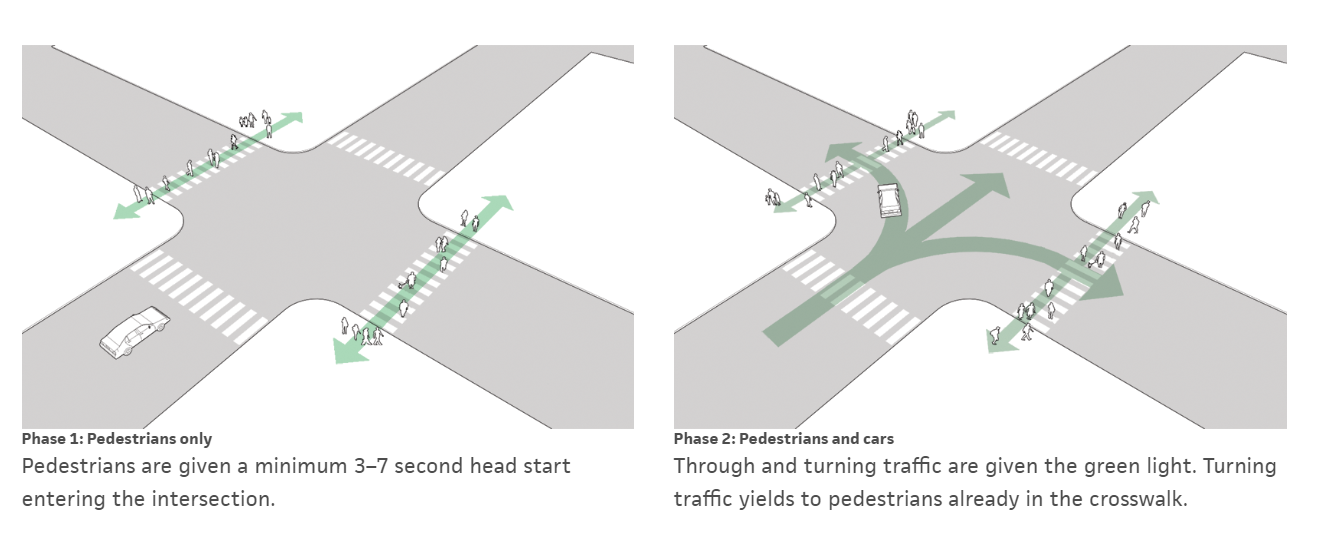
Source: https://nacto.org/publication/urban-street-design-guide/intersection-design-elements/traffic-signals/leading-pedestrian-interval/
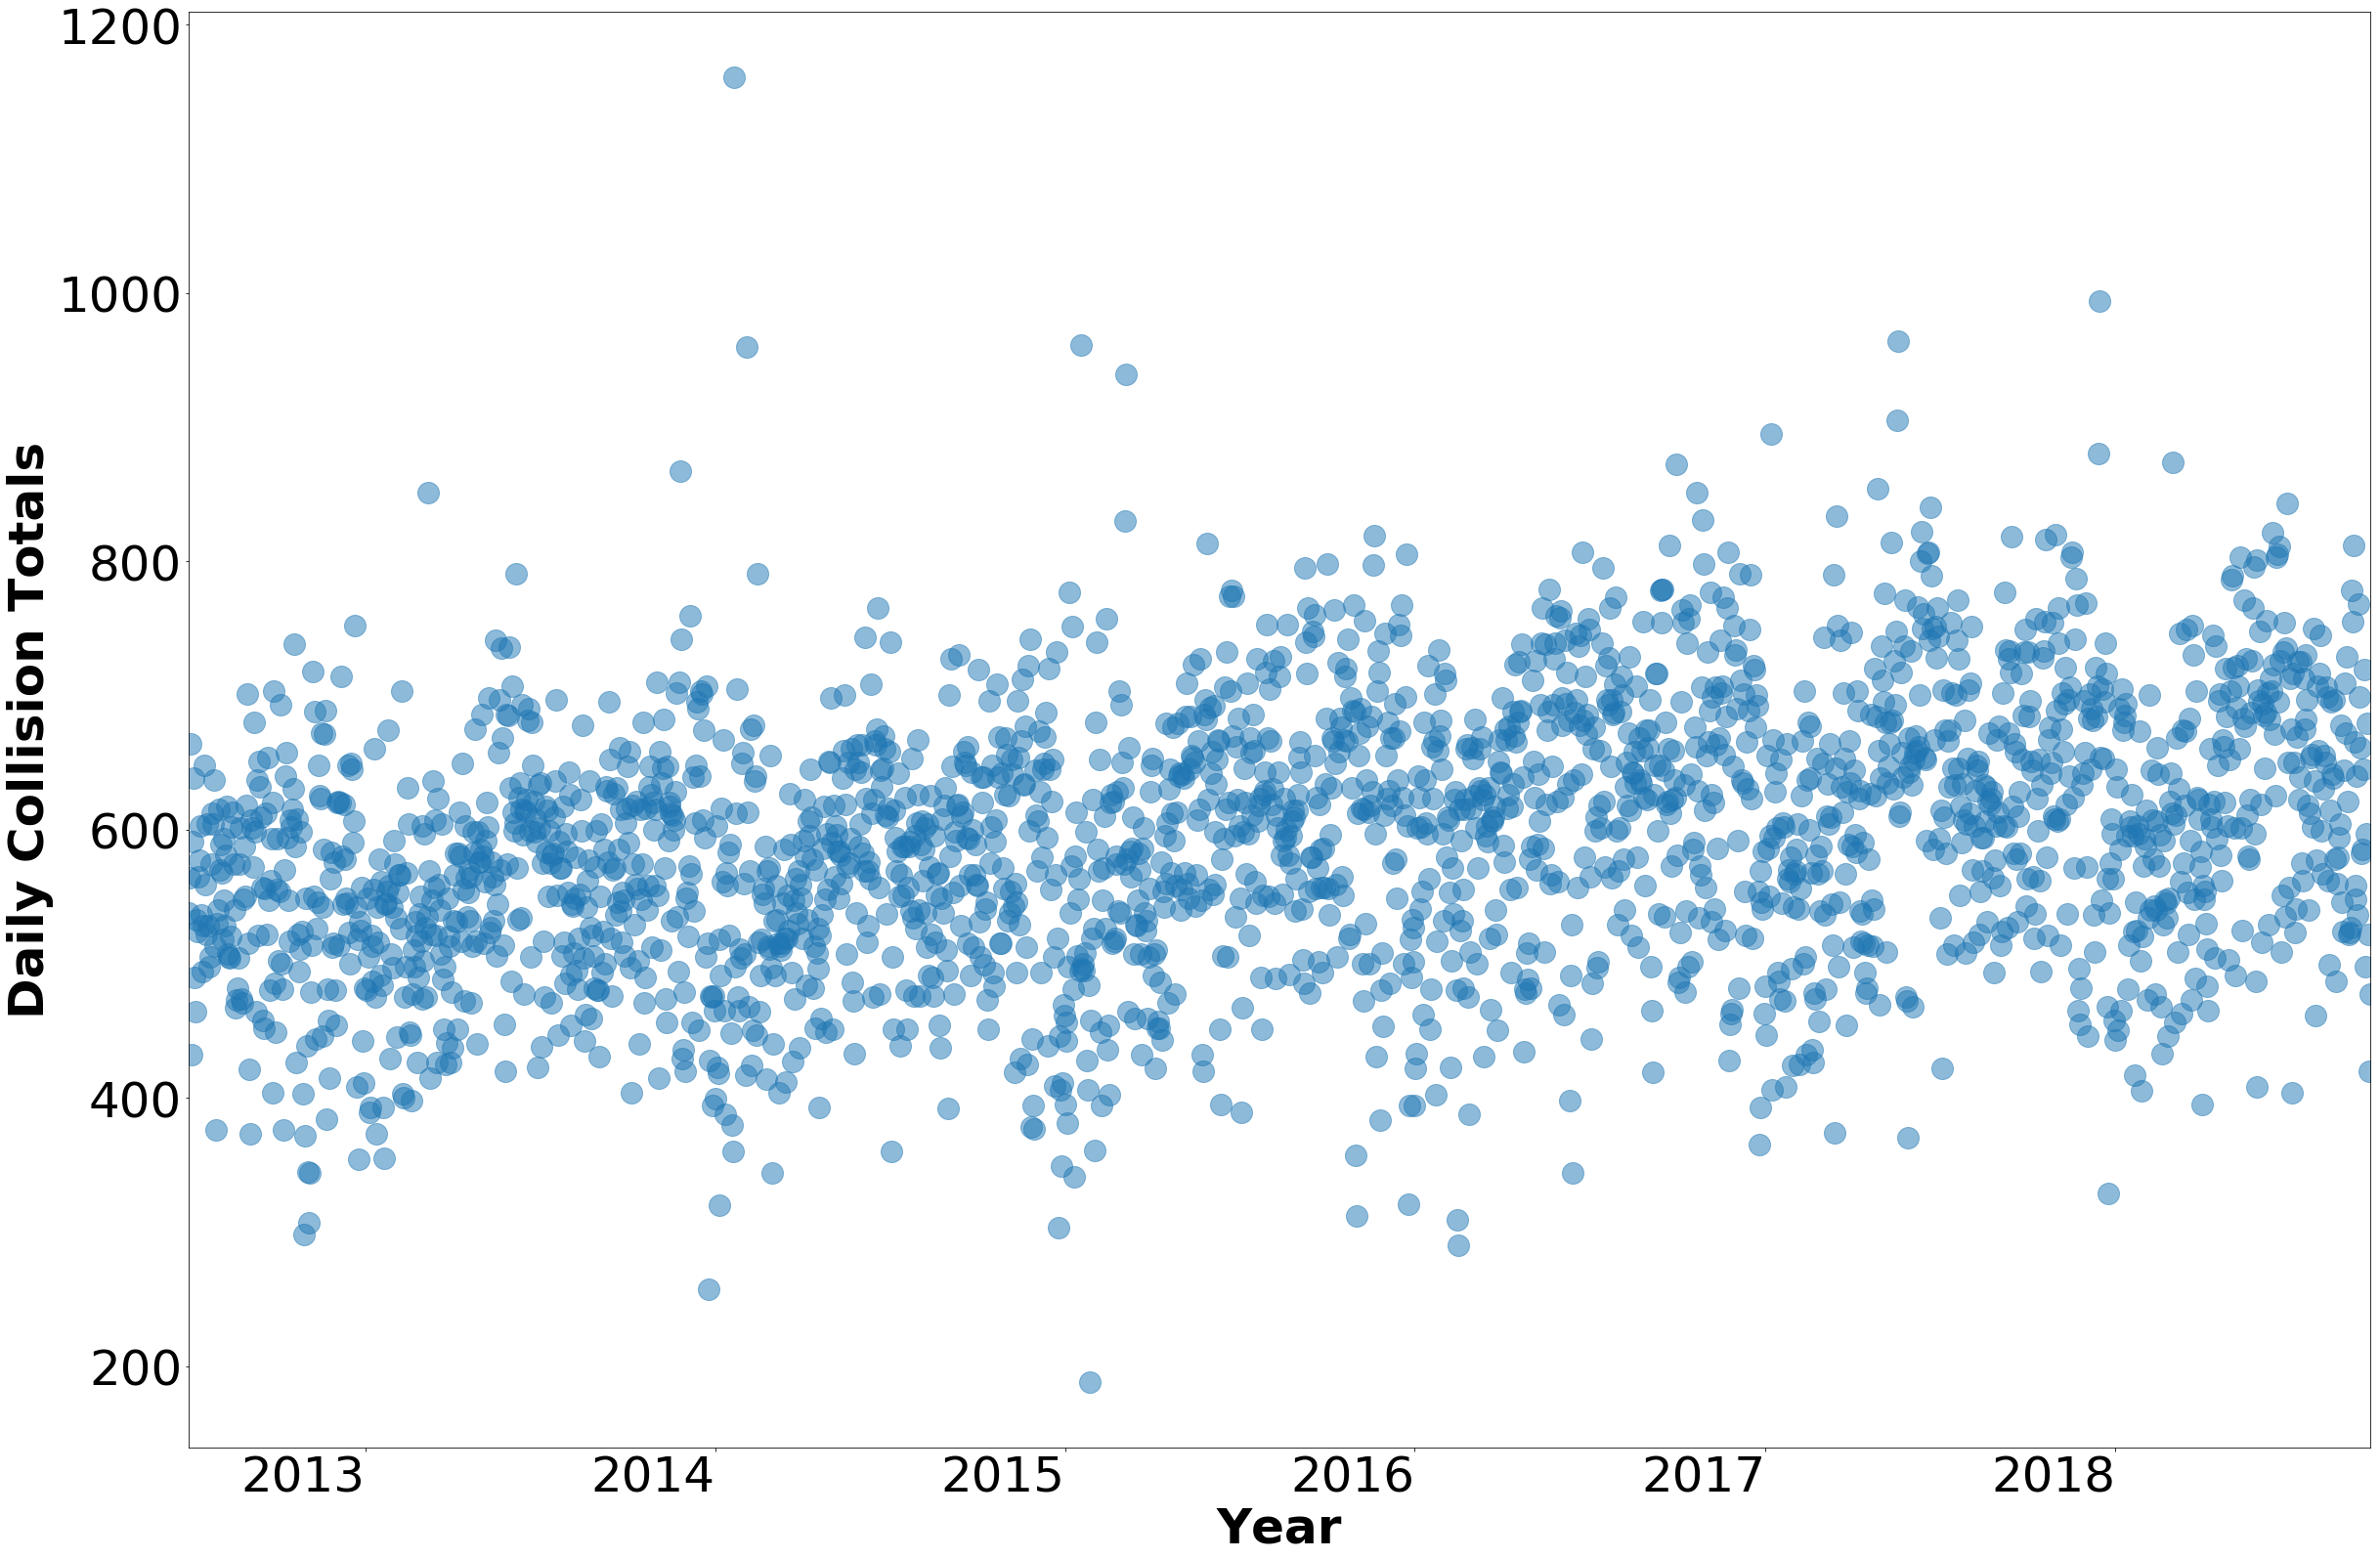
NYPD Motor Vehicle Collisions
- From July 2012 to September 2018
- Approximately 1.35 million collisions were recorded
Includes:
- collision outcomes, coordinates, streets, borough, zip code, time, vehicle type, contributing factors
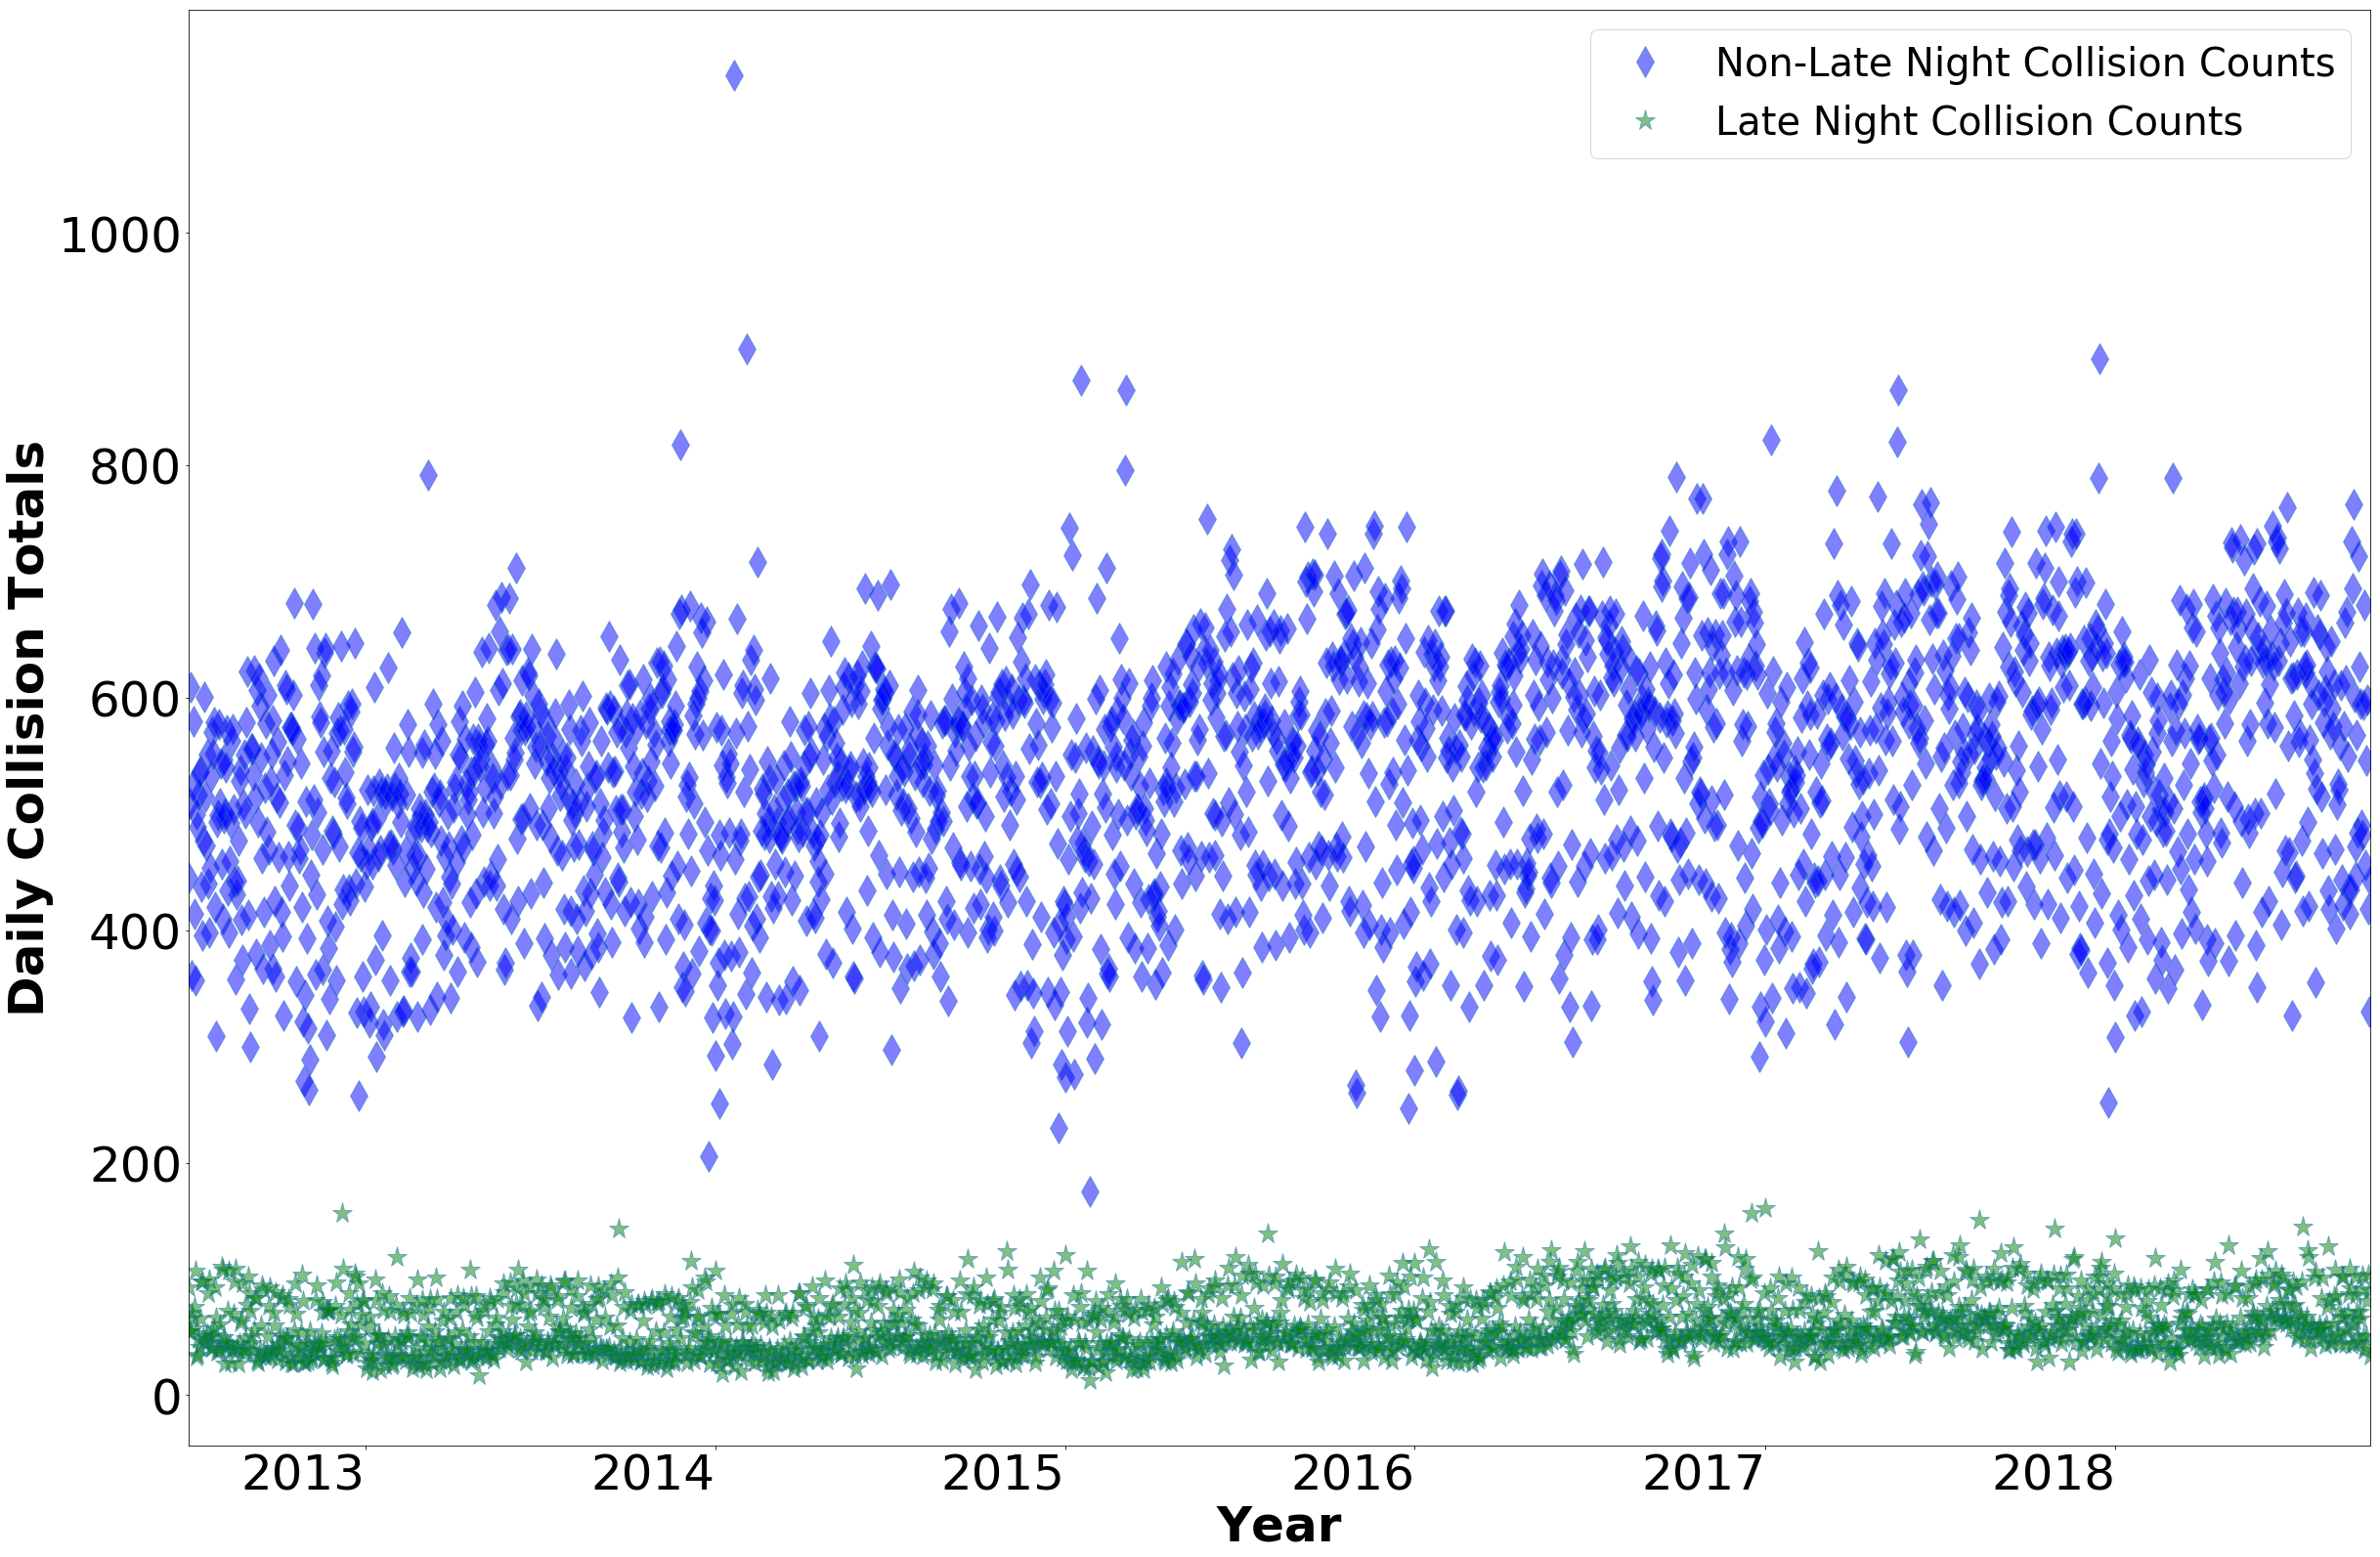
Stratified:
- 11.00 p.m. to 4.59 a.m.
- 5.00 a.m. to 10.59 p.m.
Hypothesis
The introduction of LPIs reduced collisions and injuries
2. Challenges and Solution
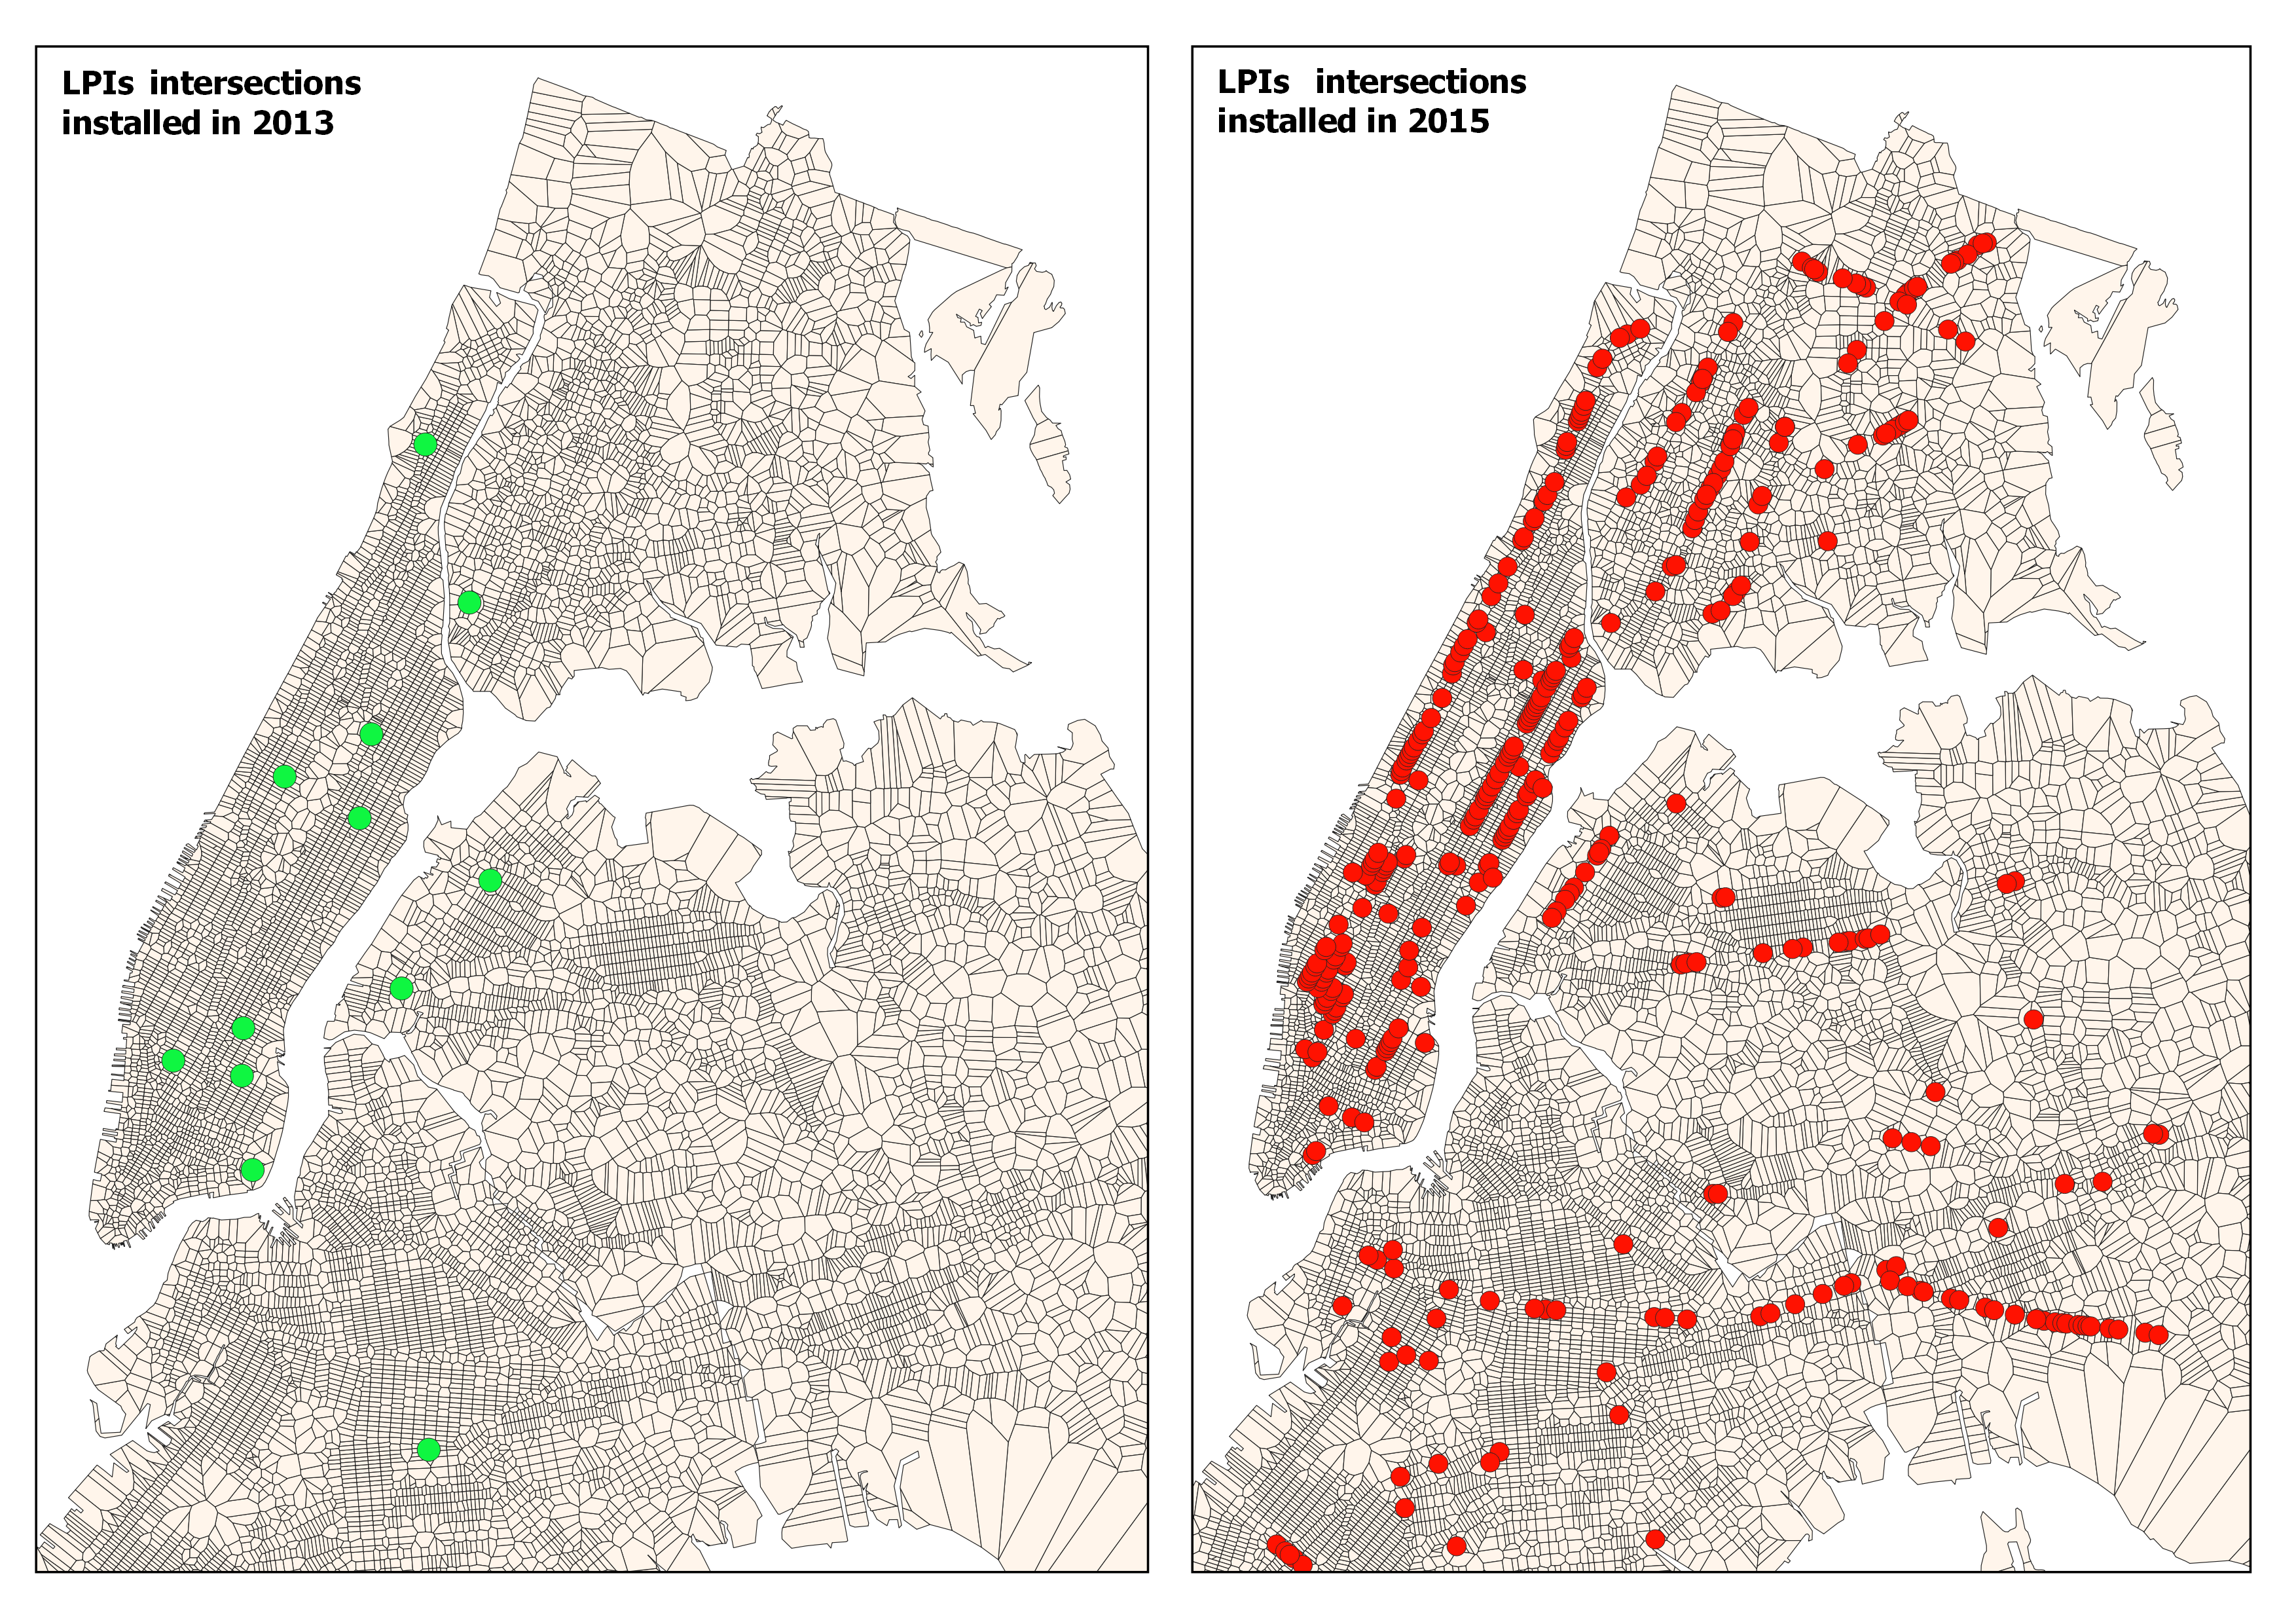
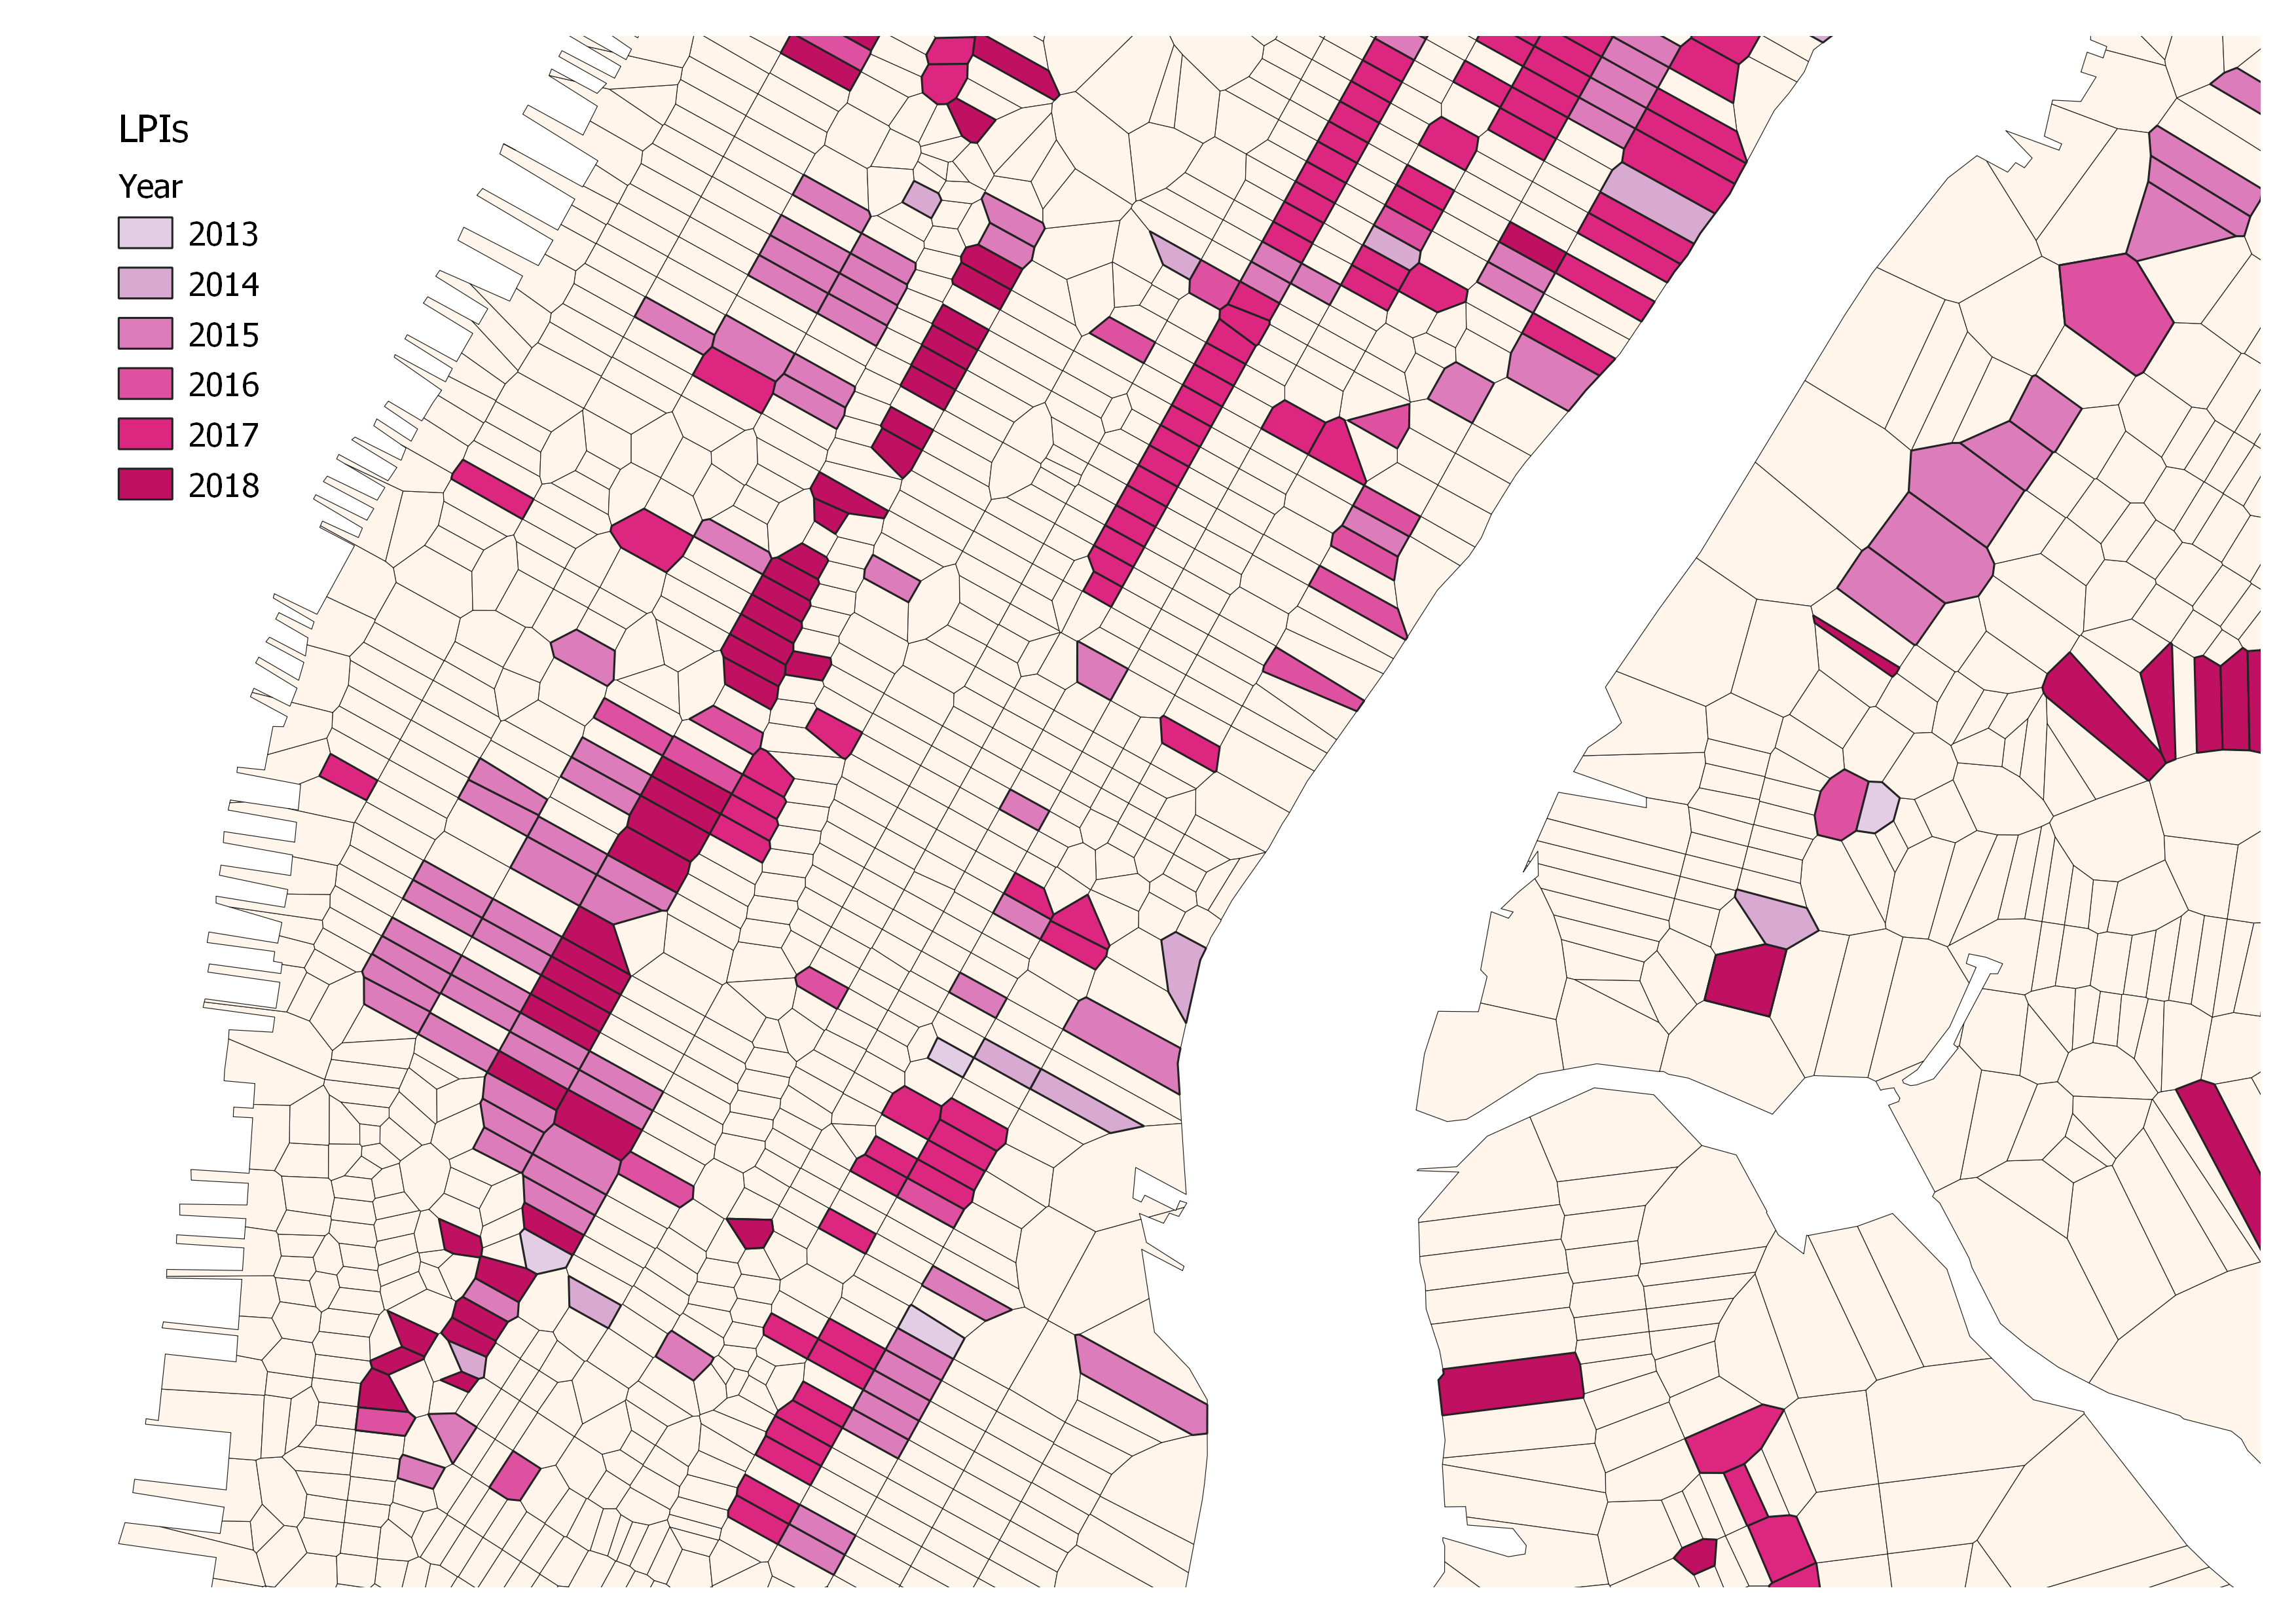
Selective implementation
Phased introduction
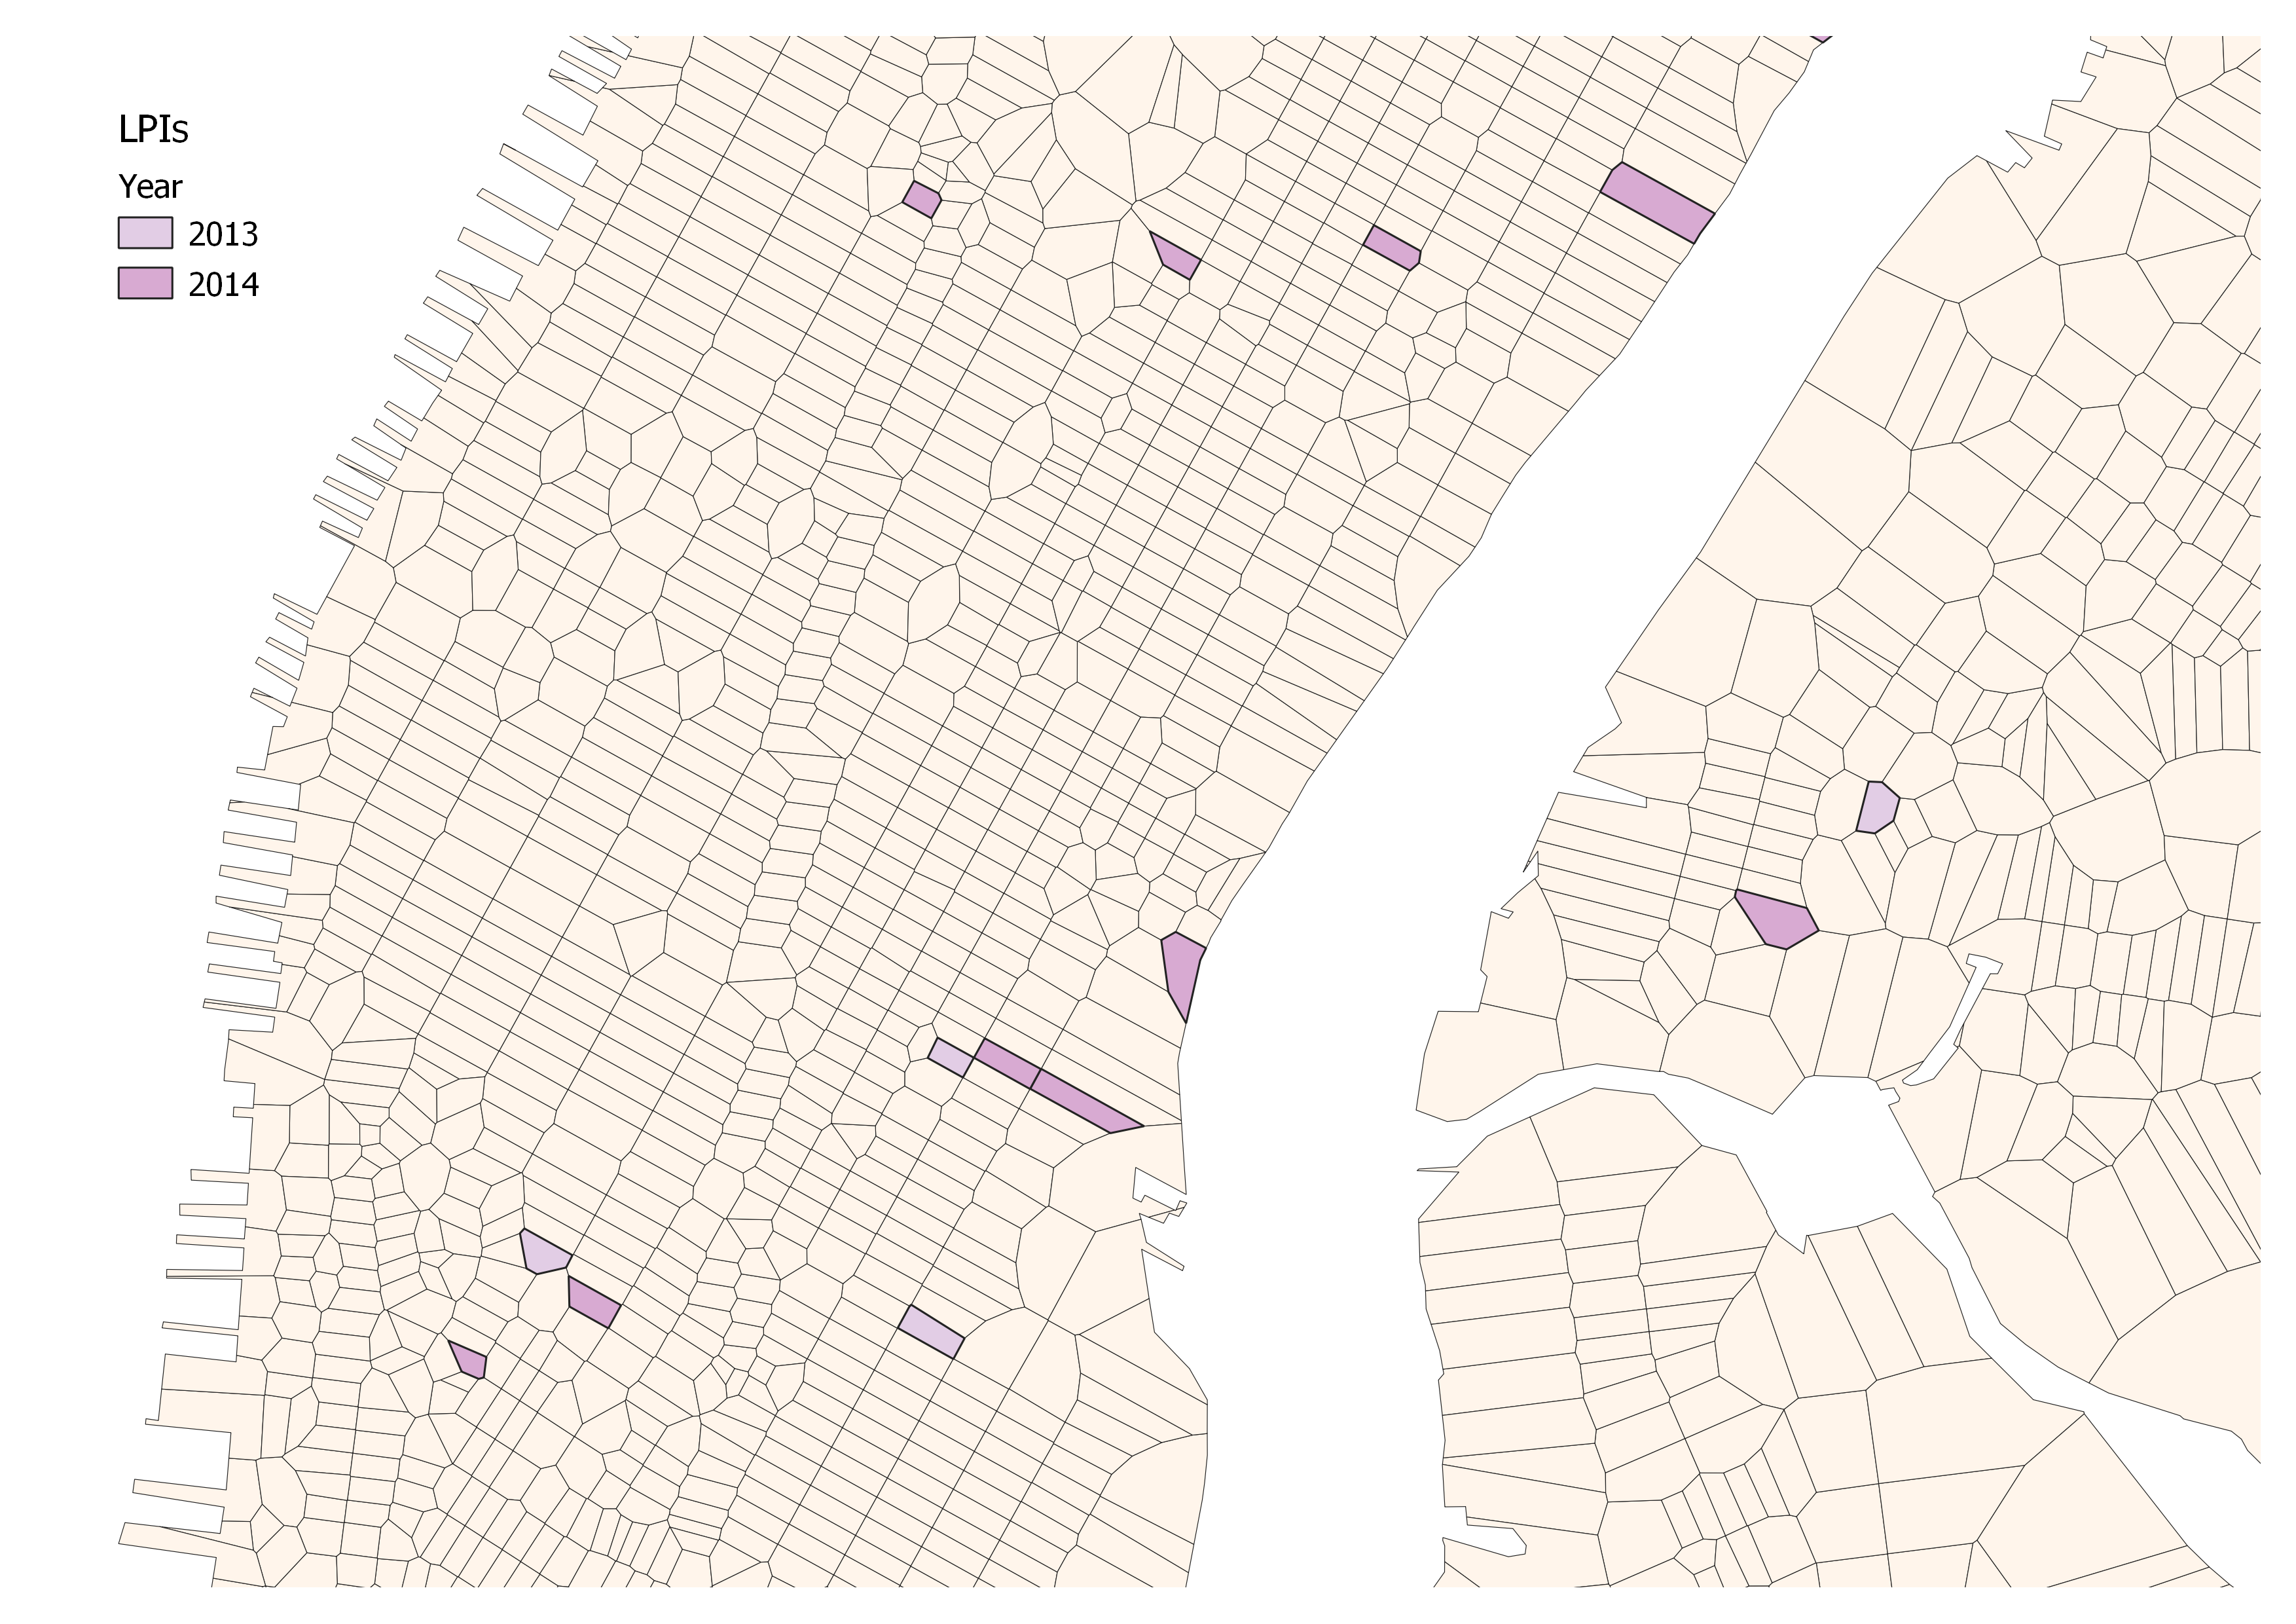
Phased introduction
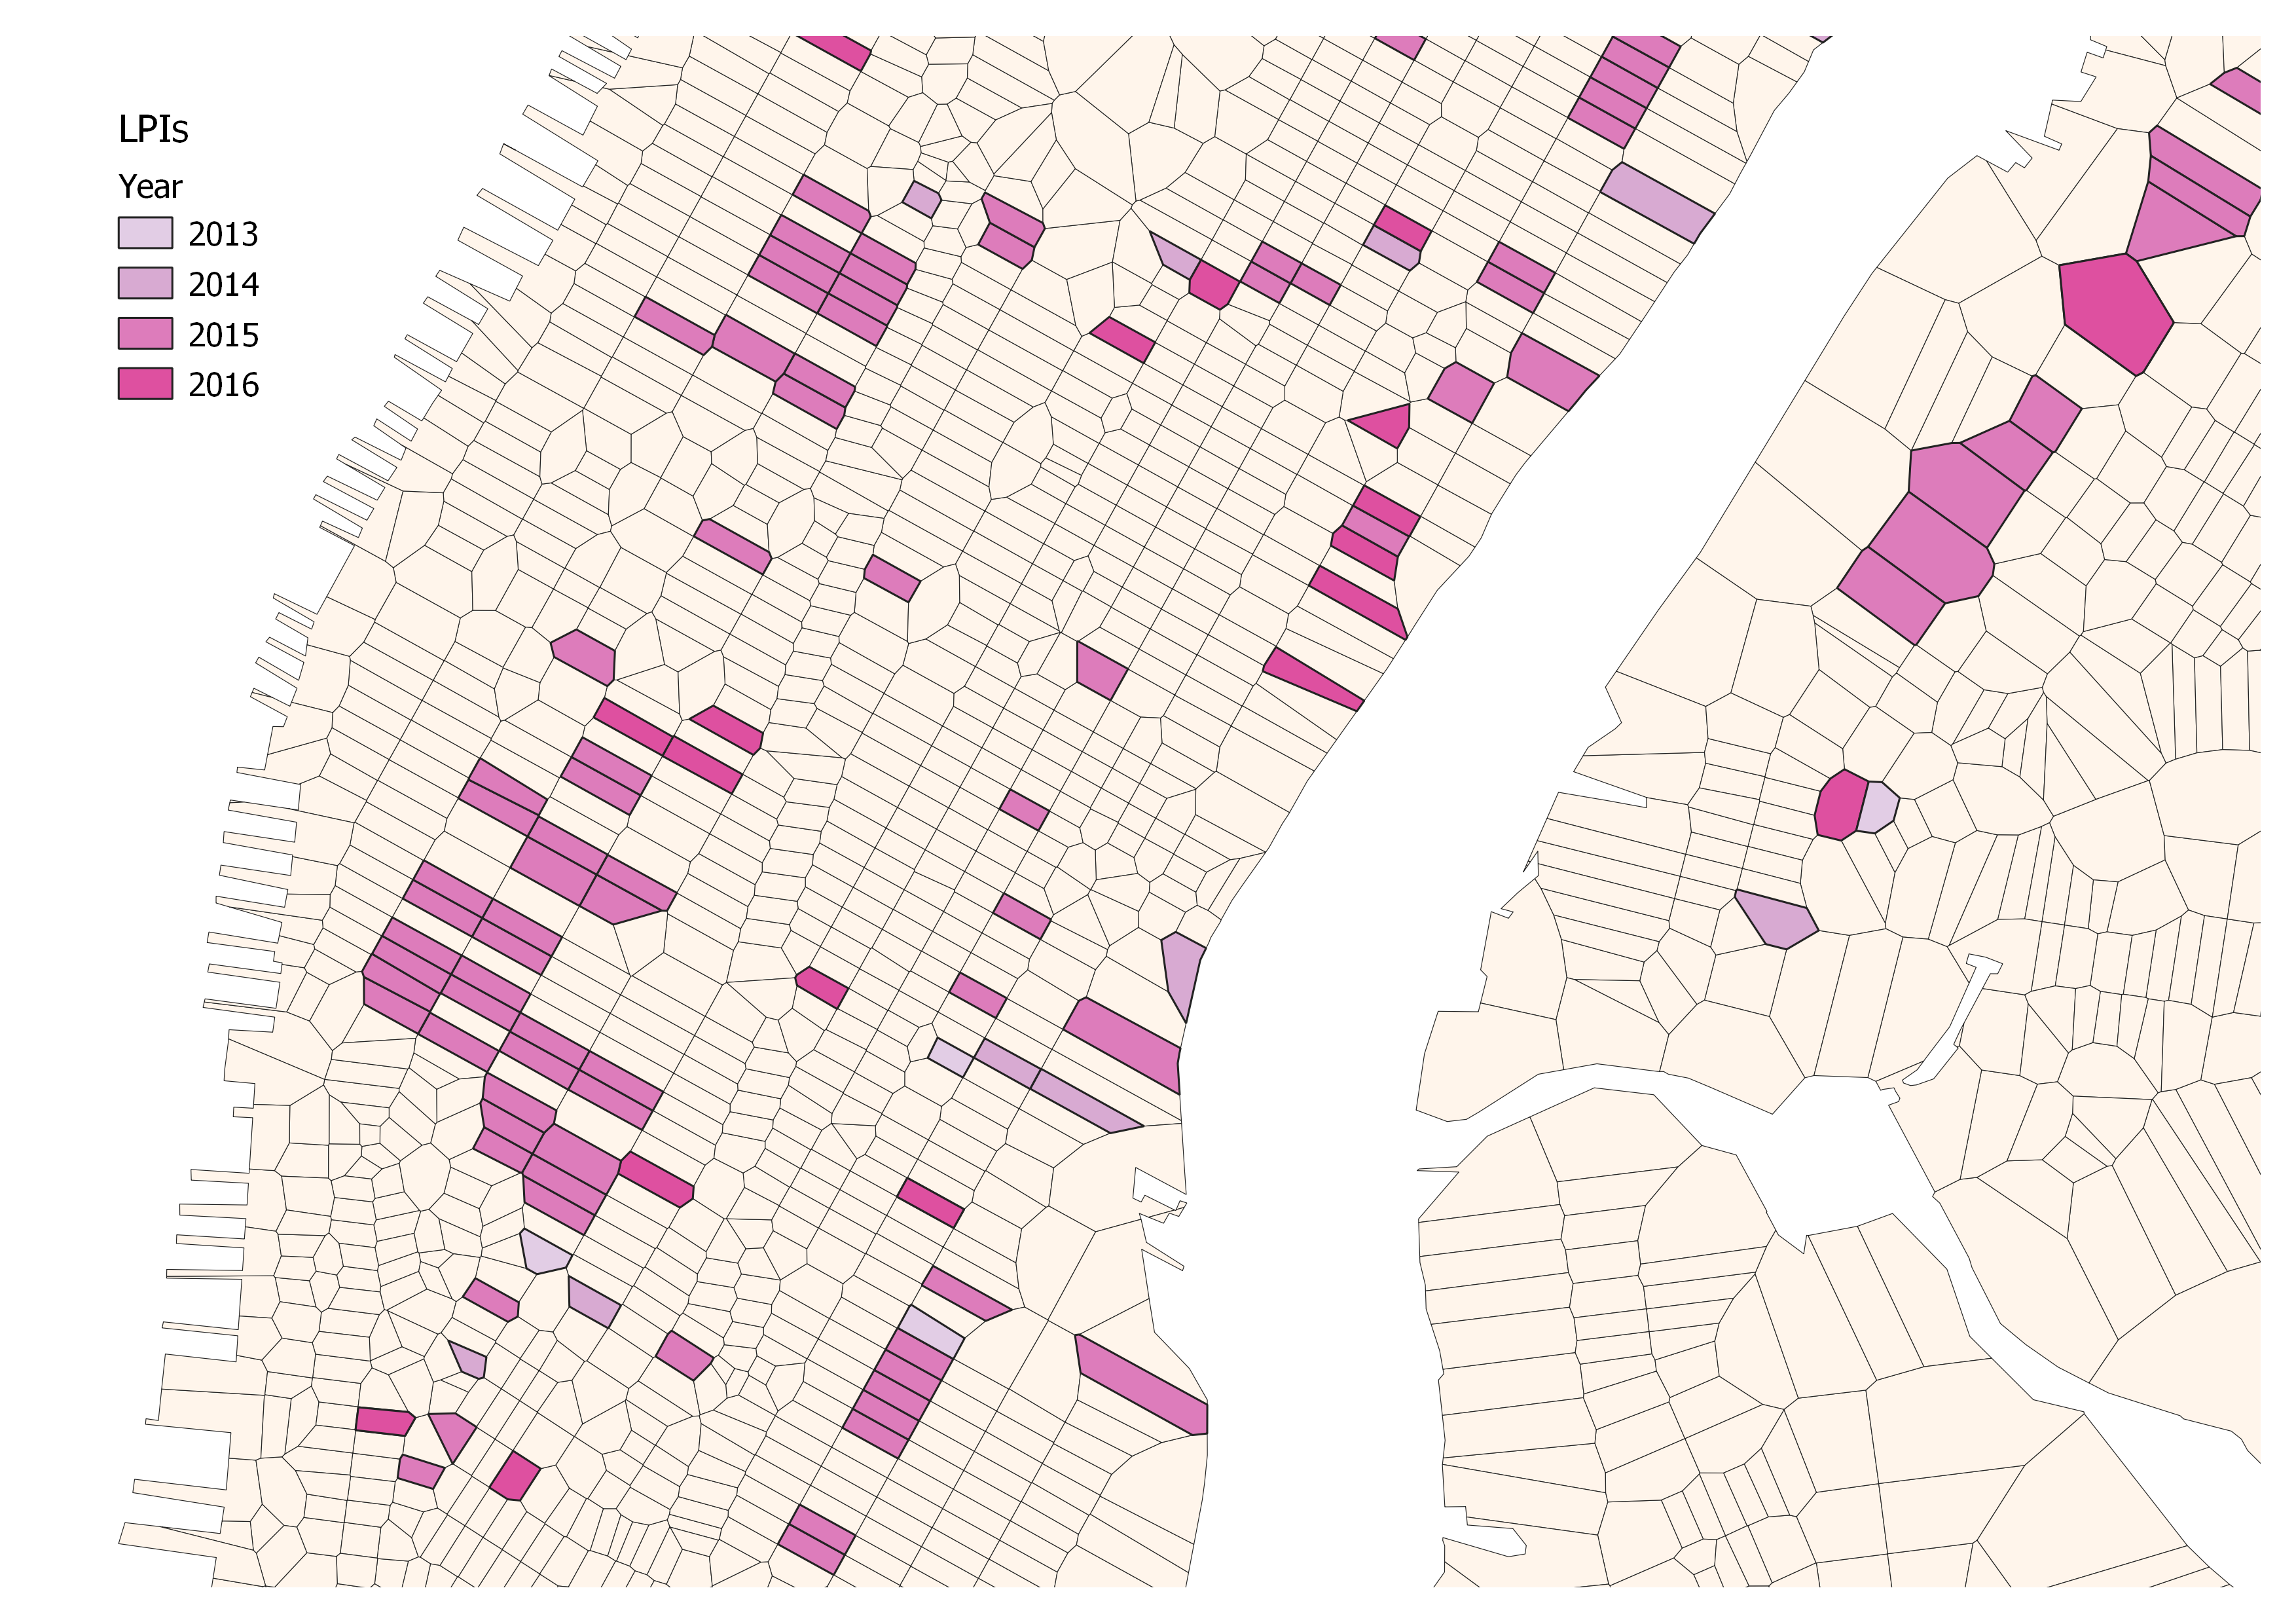
Phased introduction
Unobserved heterogeneity
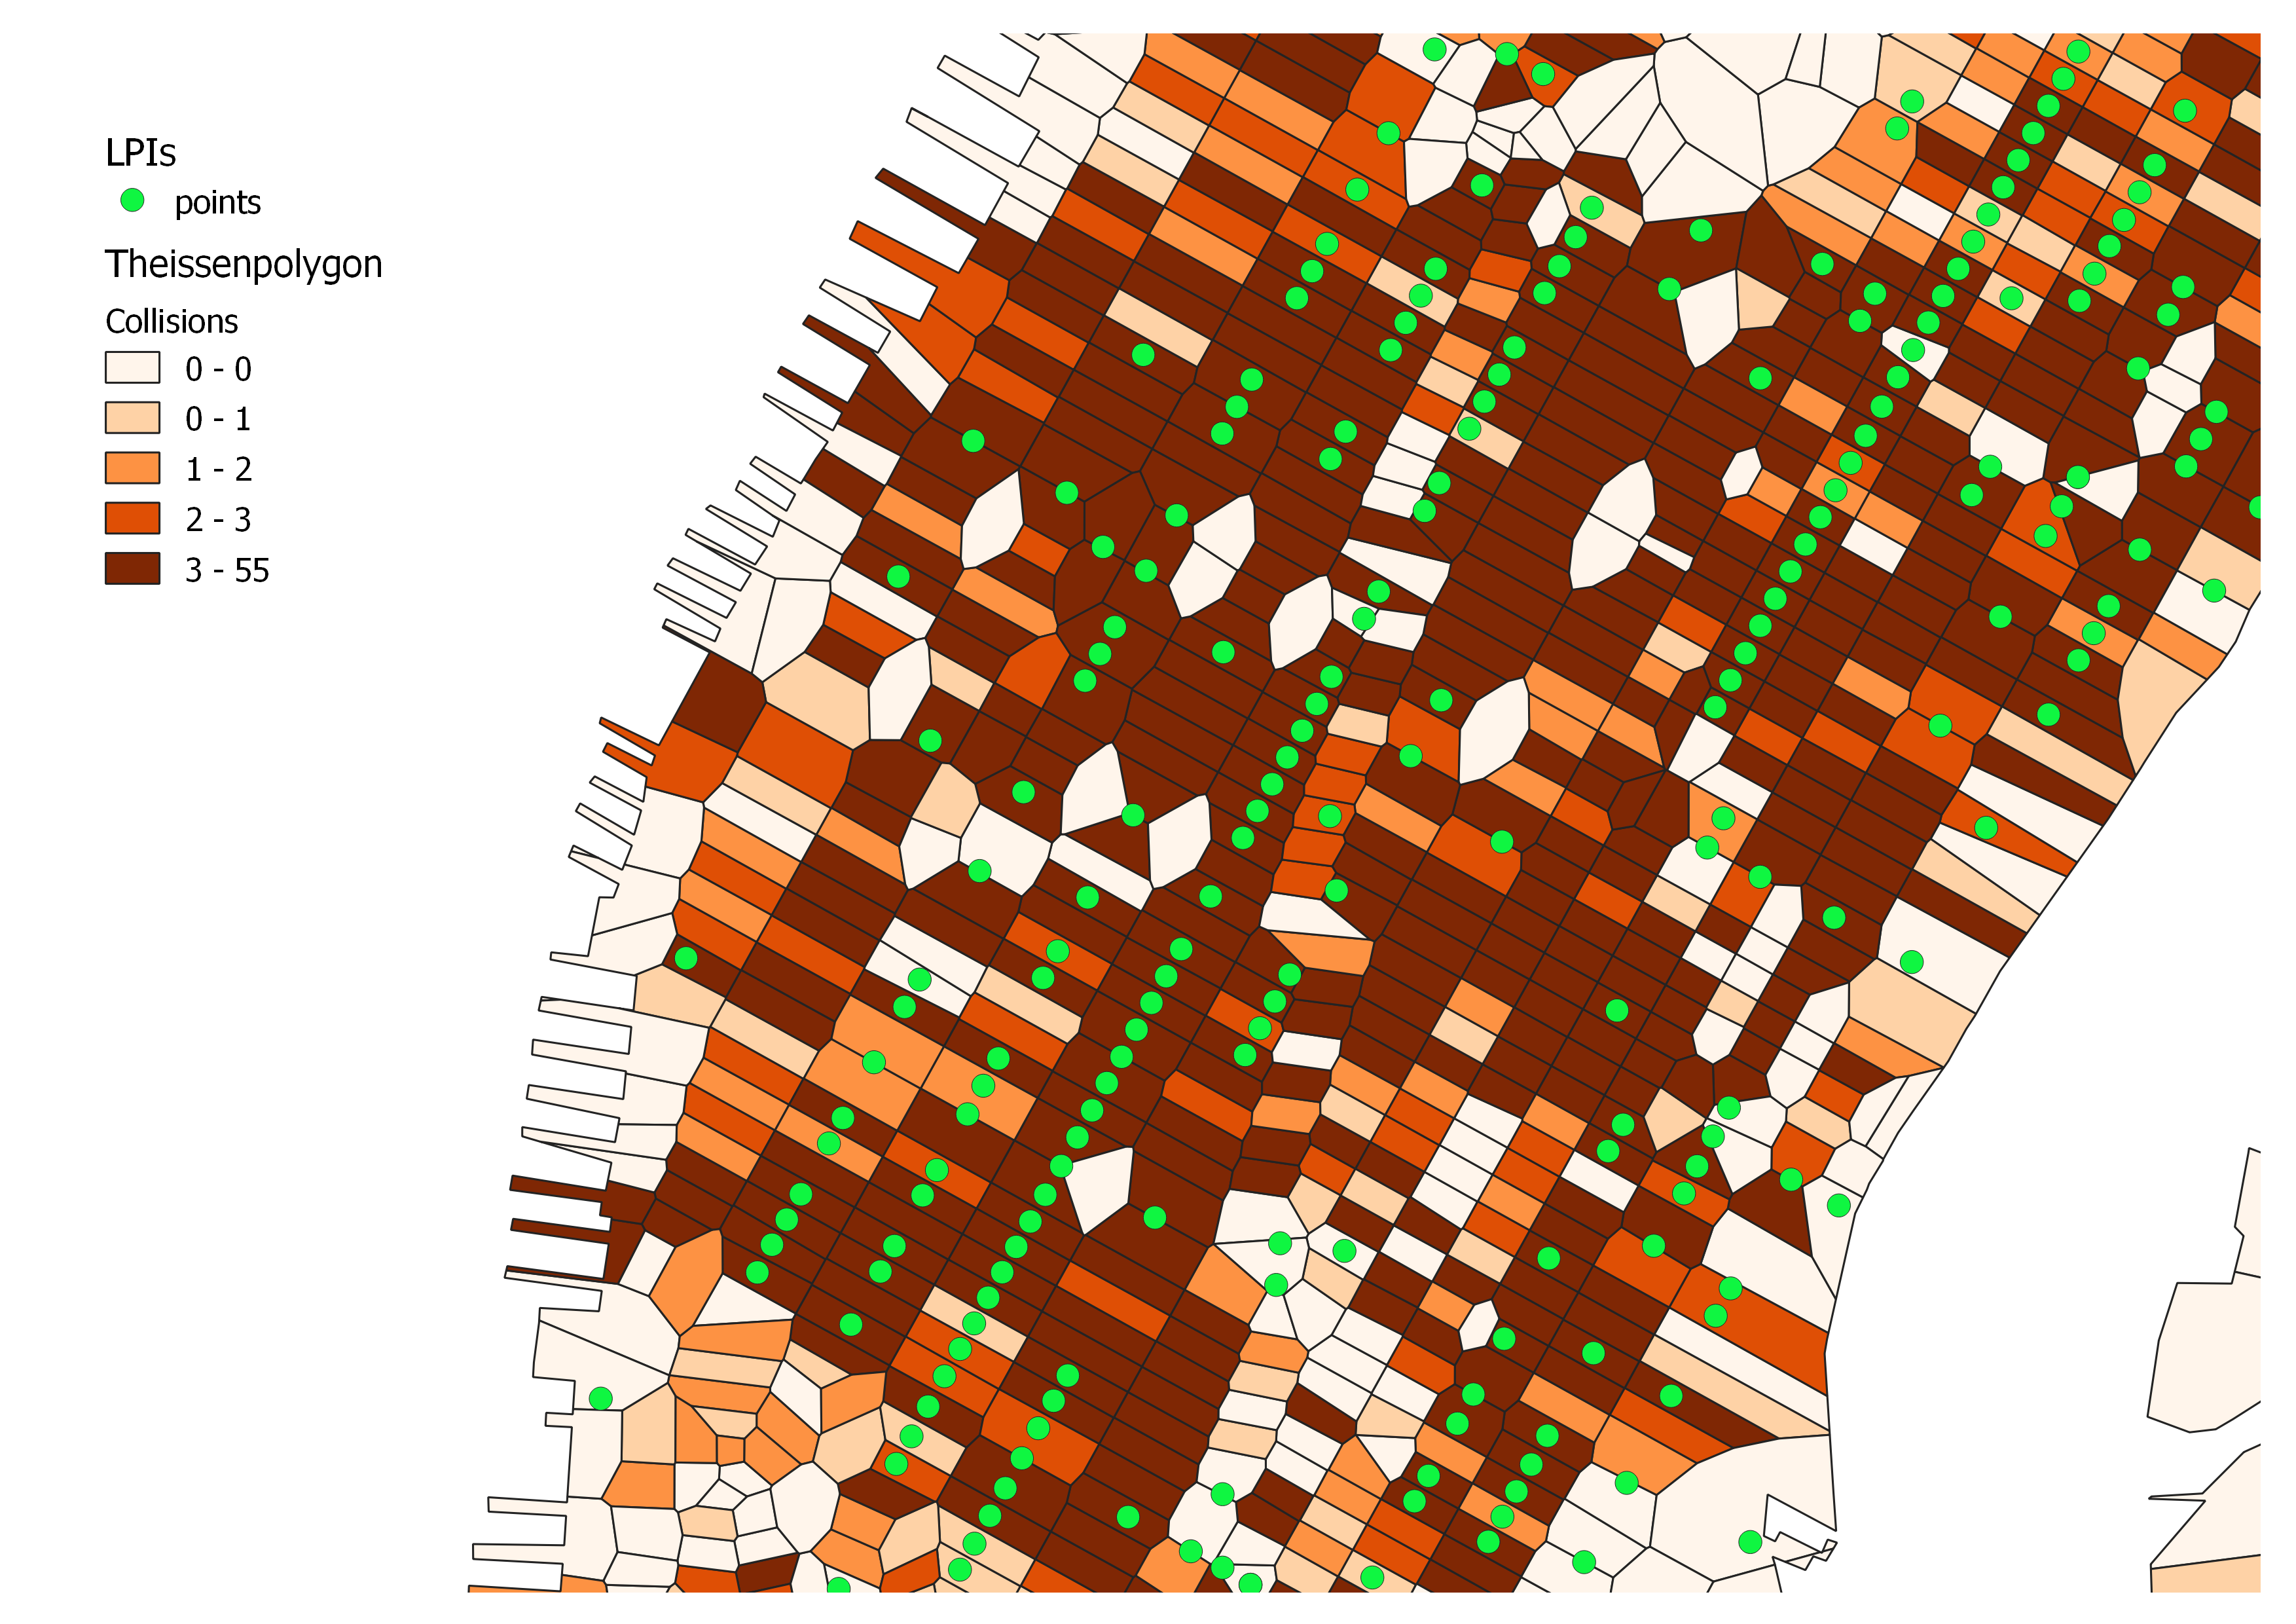
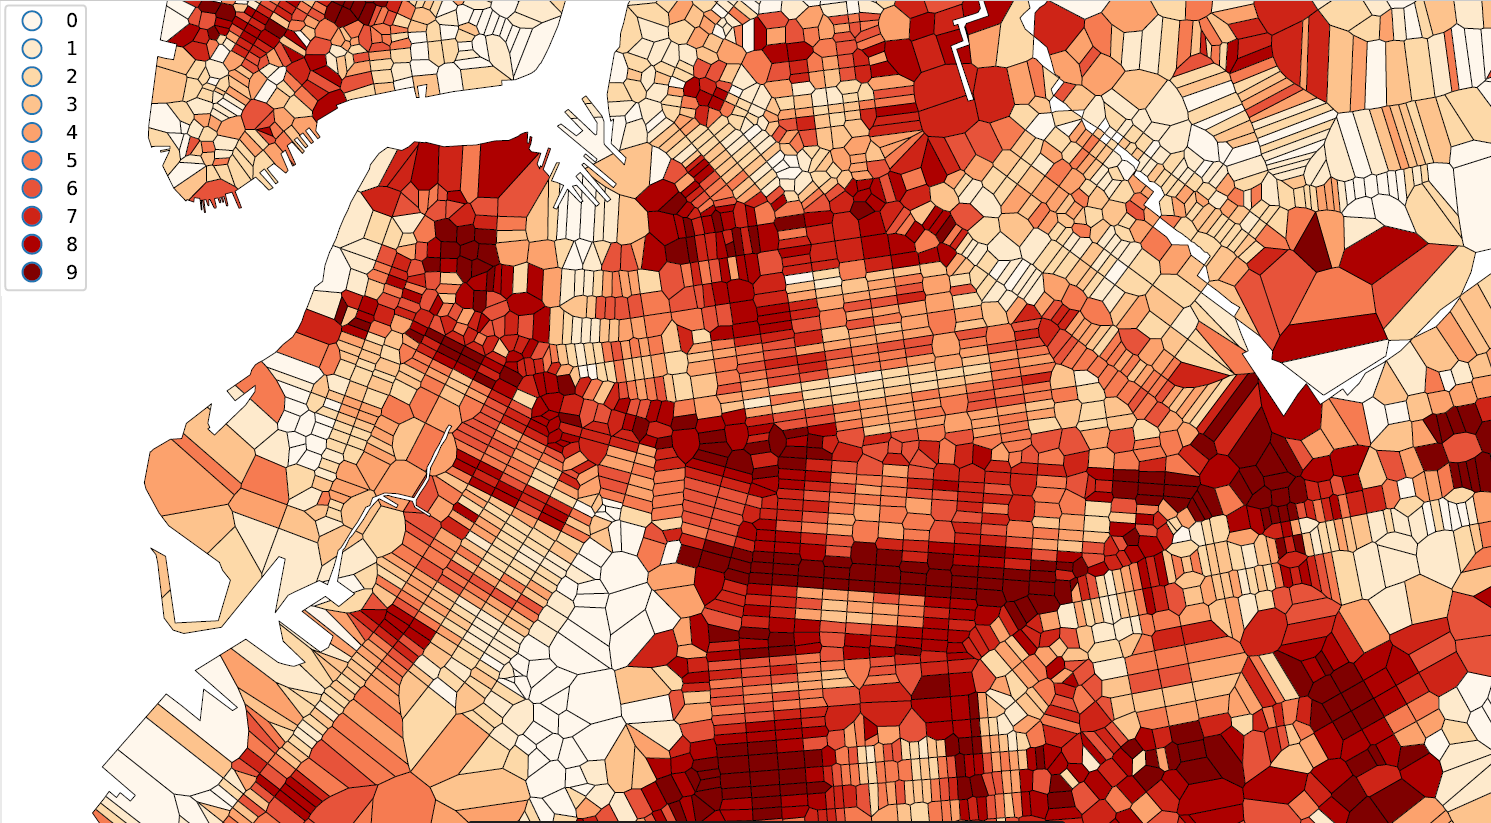
Spatial autocorrelation
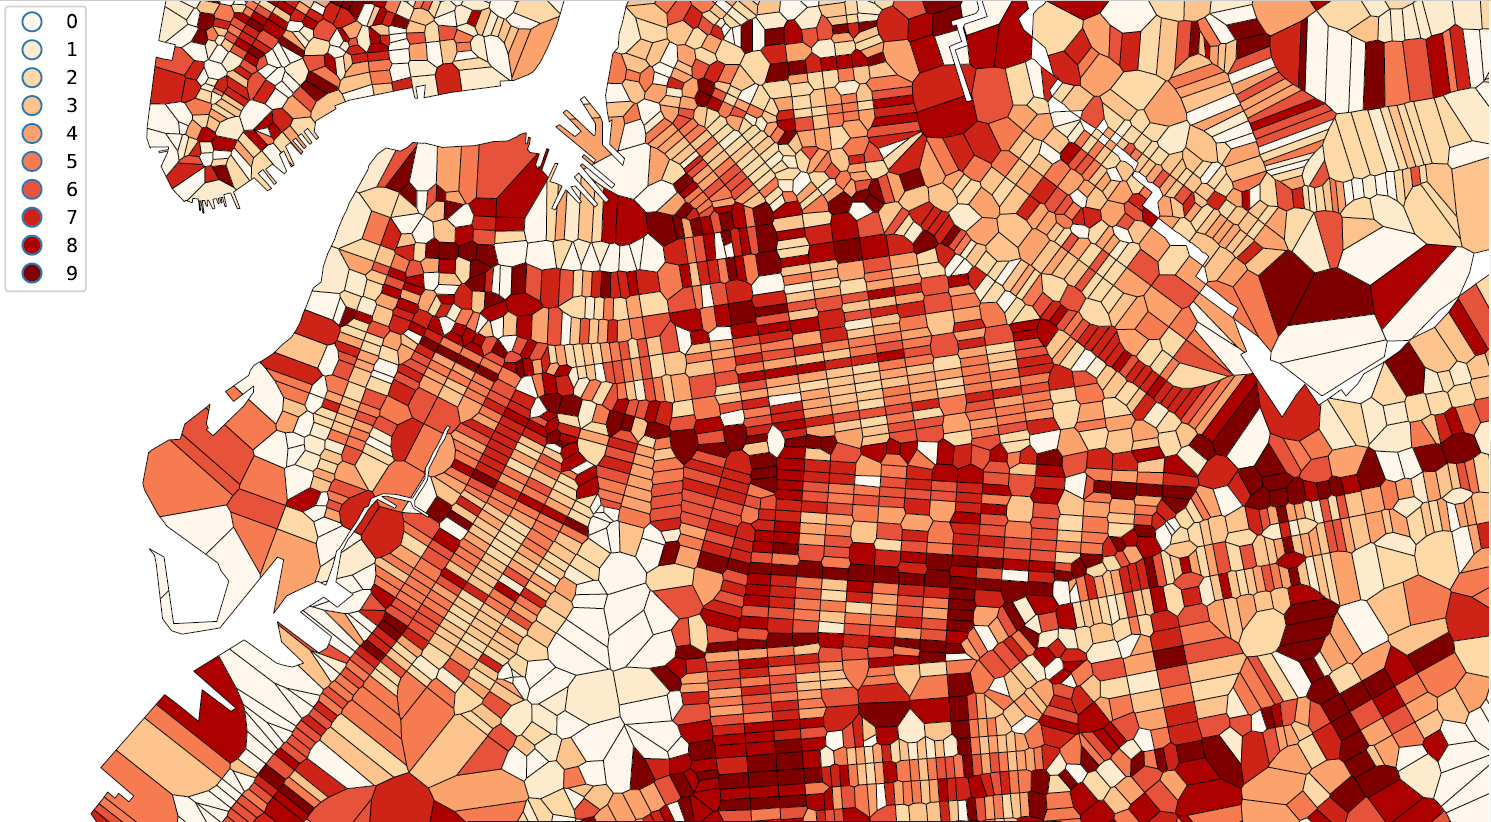
Spatial autocorrelation
General Binary treatment Difference-in-difference model
- Simplifying from 25 quarters, we can think of it as there being 3 different groups
- untreated group $U$
- early treatment group $k$ that receives treatment at $t^*_k$
- late treatment group $l$ that receives treatment at $t^*_l$
General Binary treatment Difference-in-difference model

Assumptions
- Unmeasured determinants of the outcomes were time invariant or group invariant
- Common trends assumption
- Timing of the treatment implementation must be statistically independent of the potential outcomes distributions, conditional on the group-and time-fixed effects
3. Results
Model Specifications and controls
- Indicator for when intersections received LPIs intervention
- Indicator for when Bike route was built
- Indicator for when Street Improvement was implemented
- Indicator for when Left Turn intervention was implemented
- School Zone trends
- Senior Zone trends
- Priority Intersections trends
- Time effects
- Intersection fixed effects
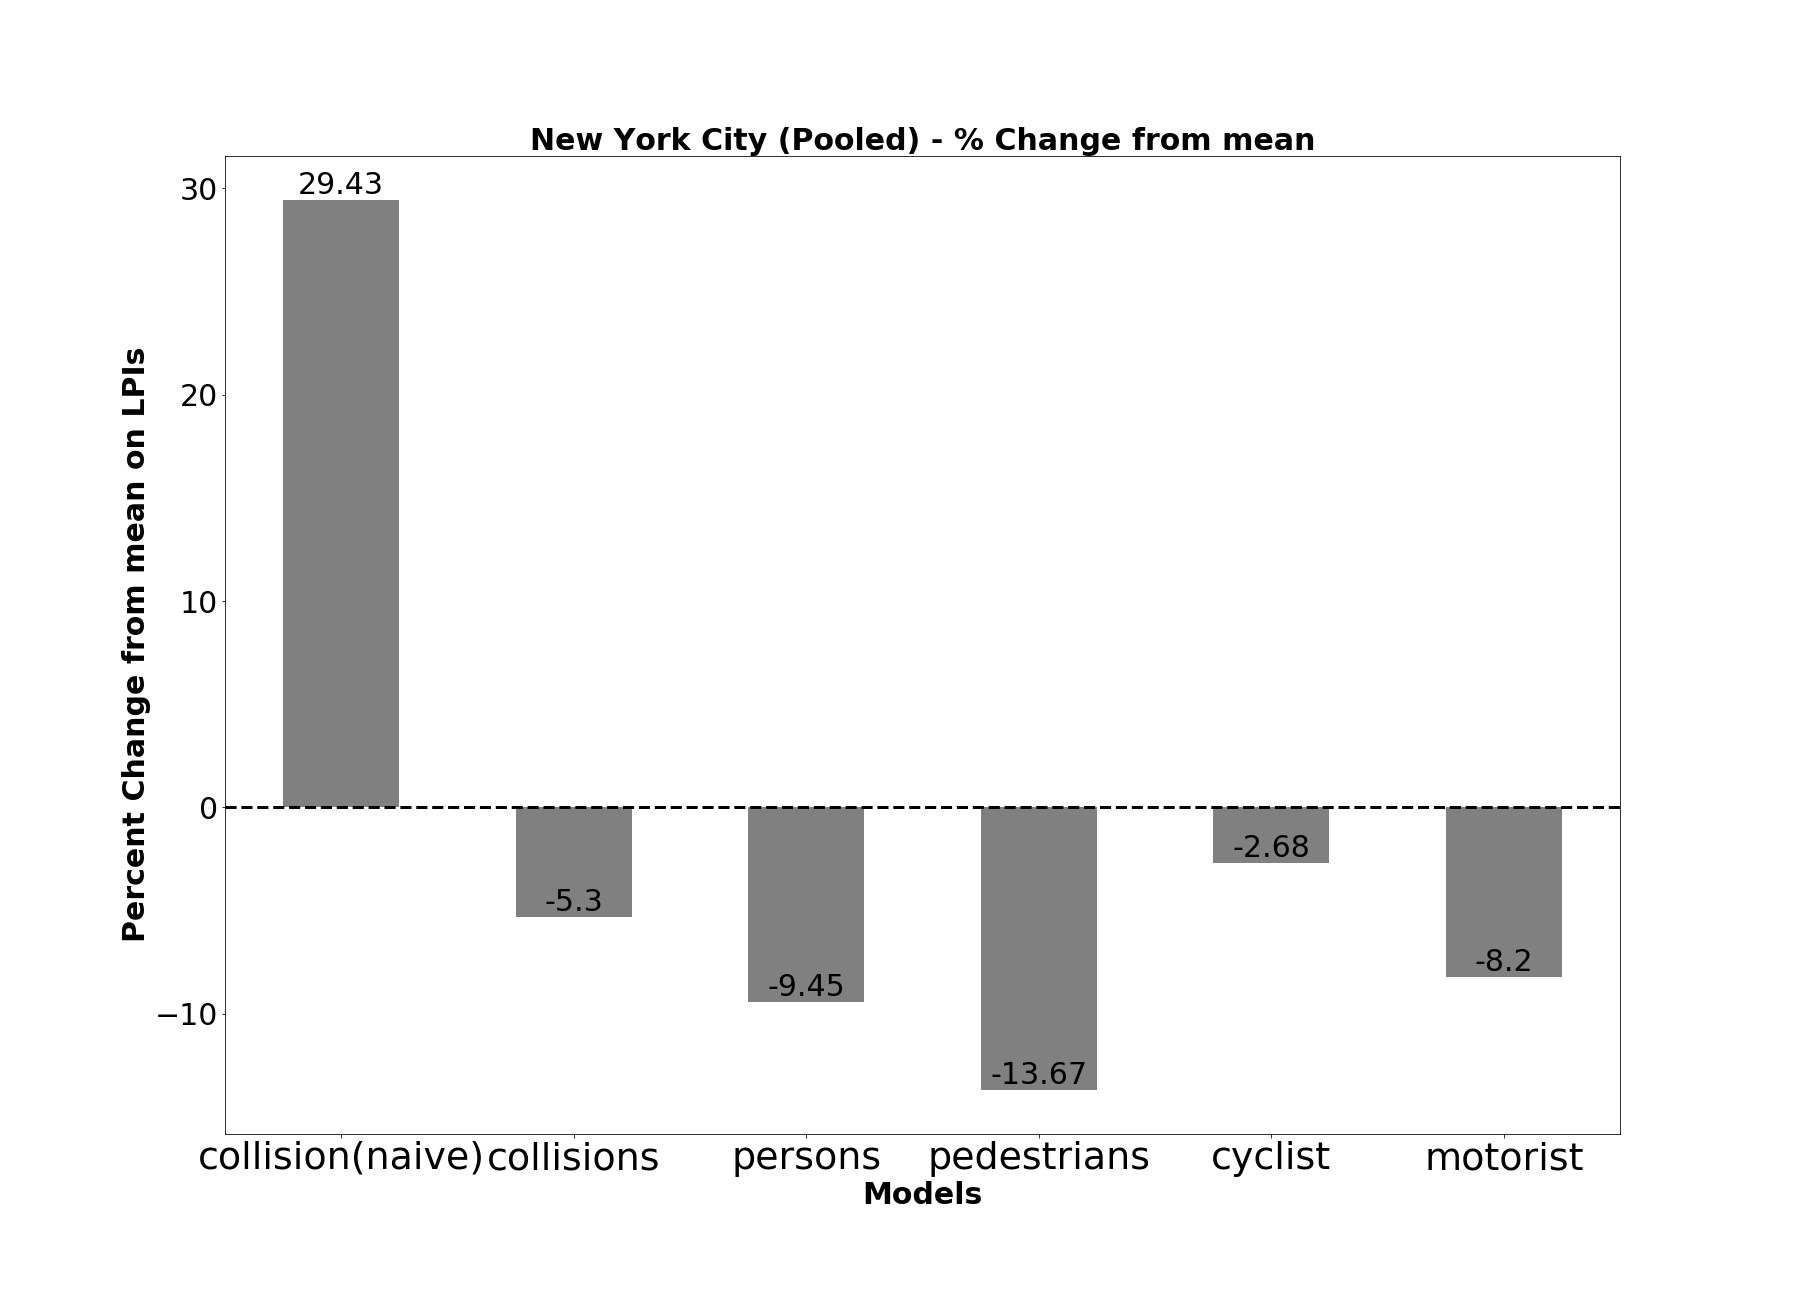
NYC Fixed effects DiD (Pooled)
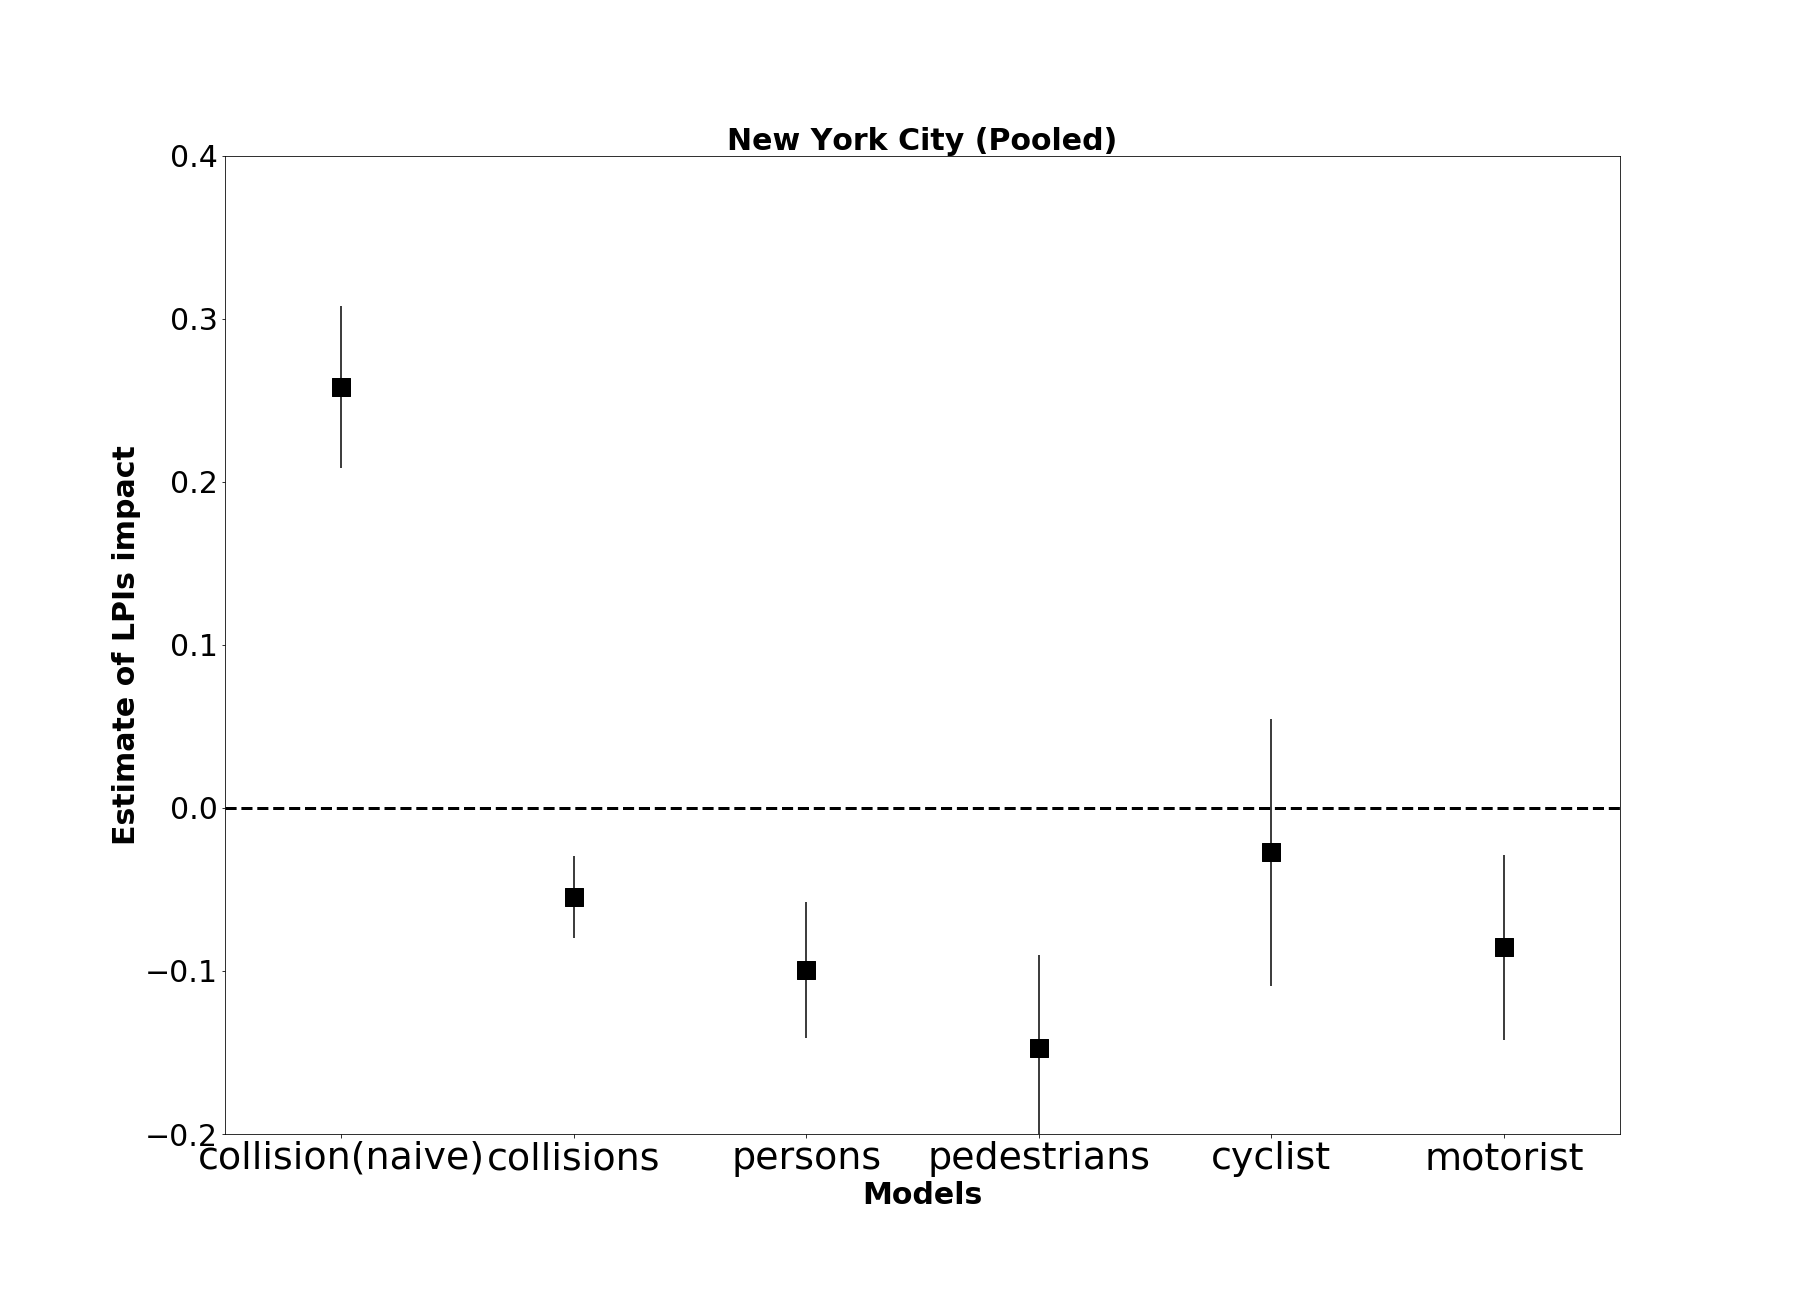
NYC Fixed effects DiD (Pooled)
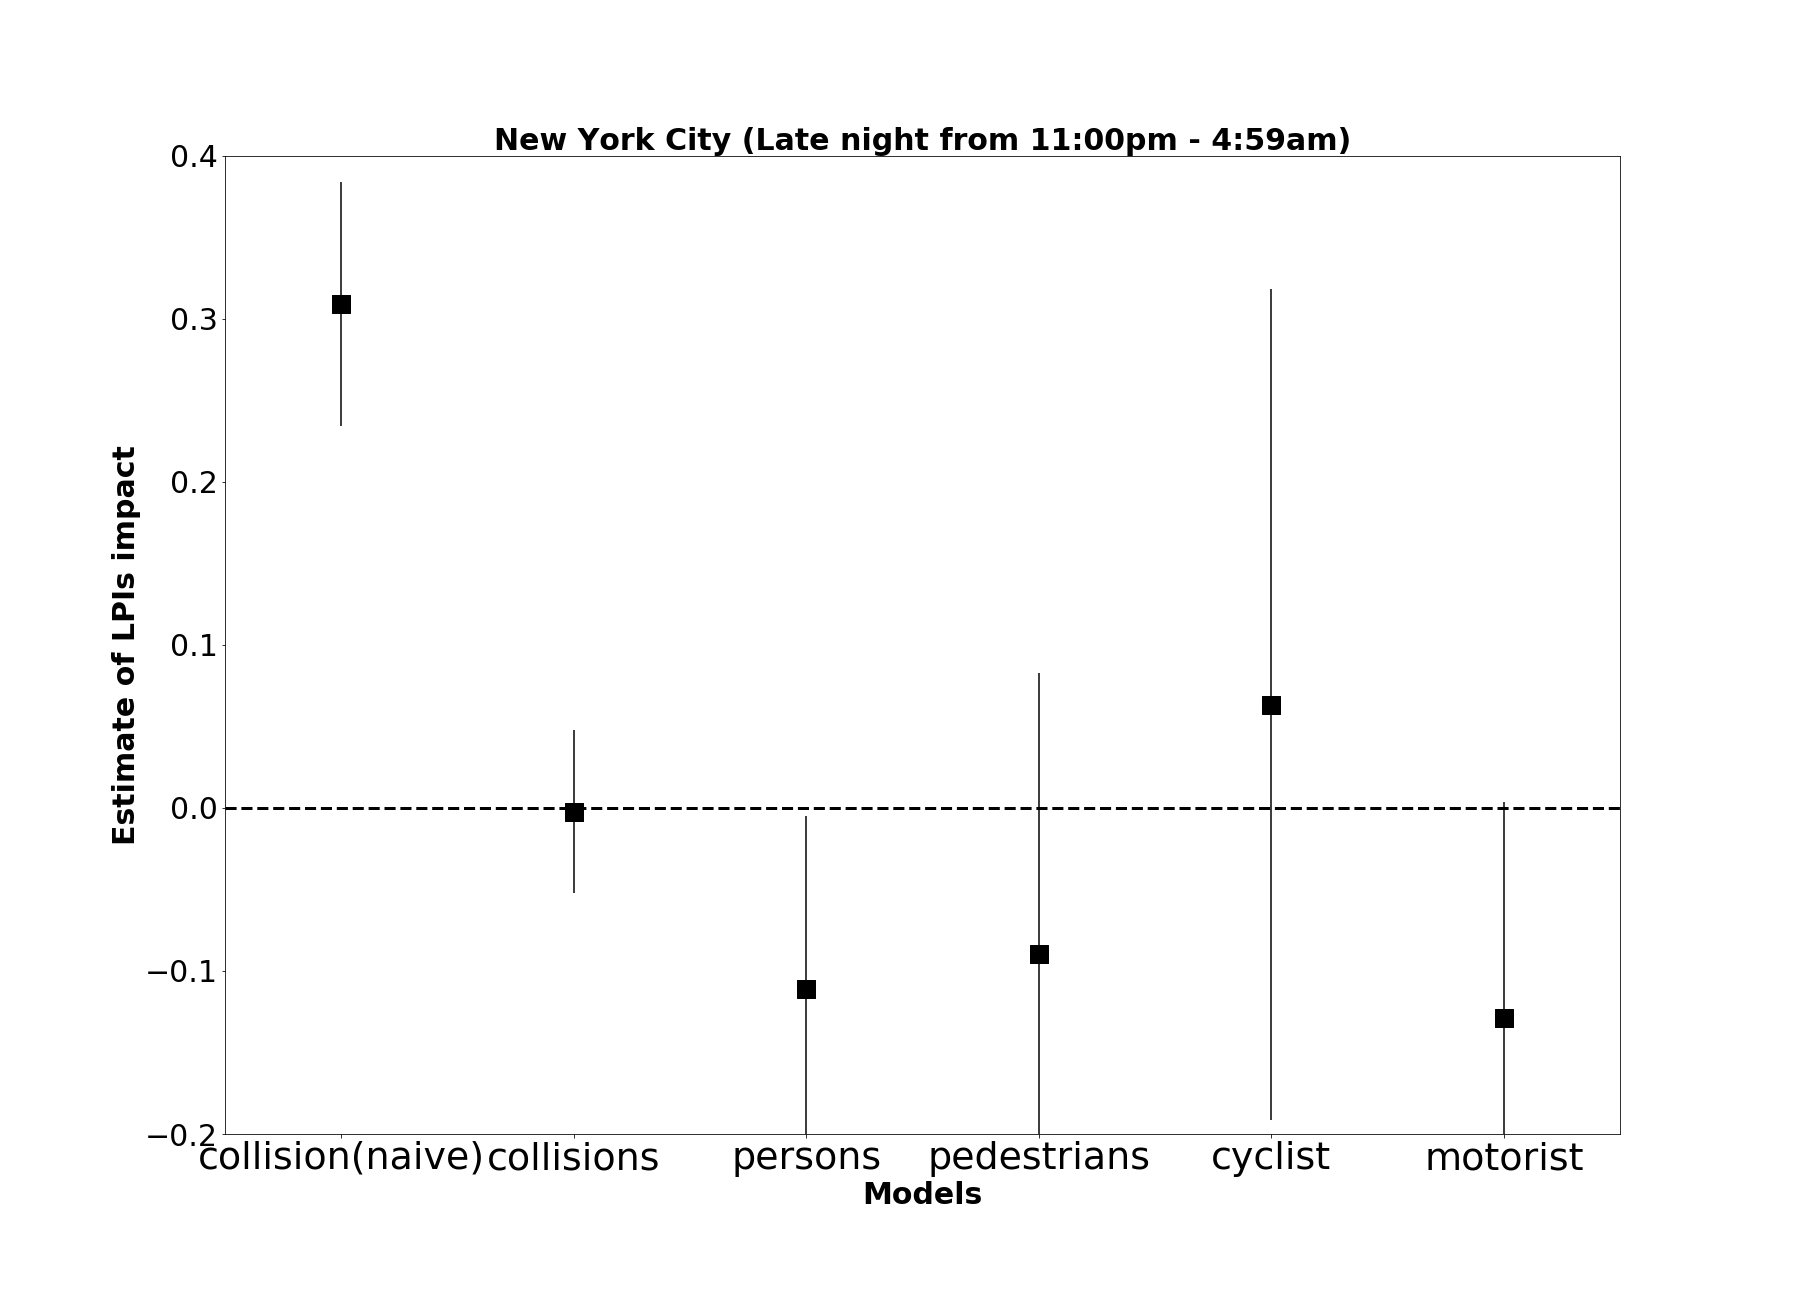
NYC Fixed Effects DiD (Late Night)
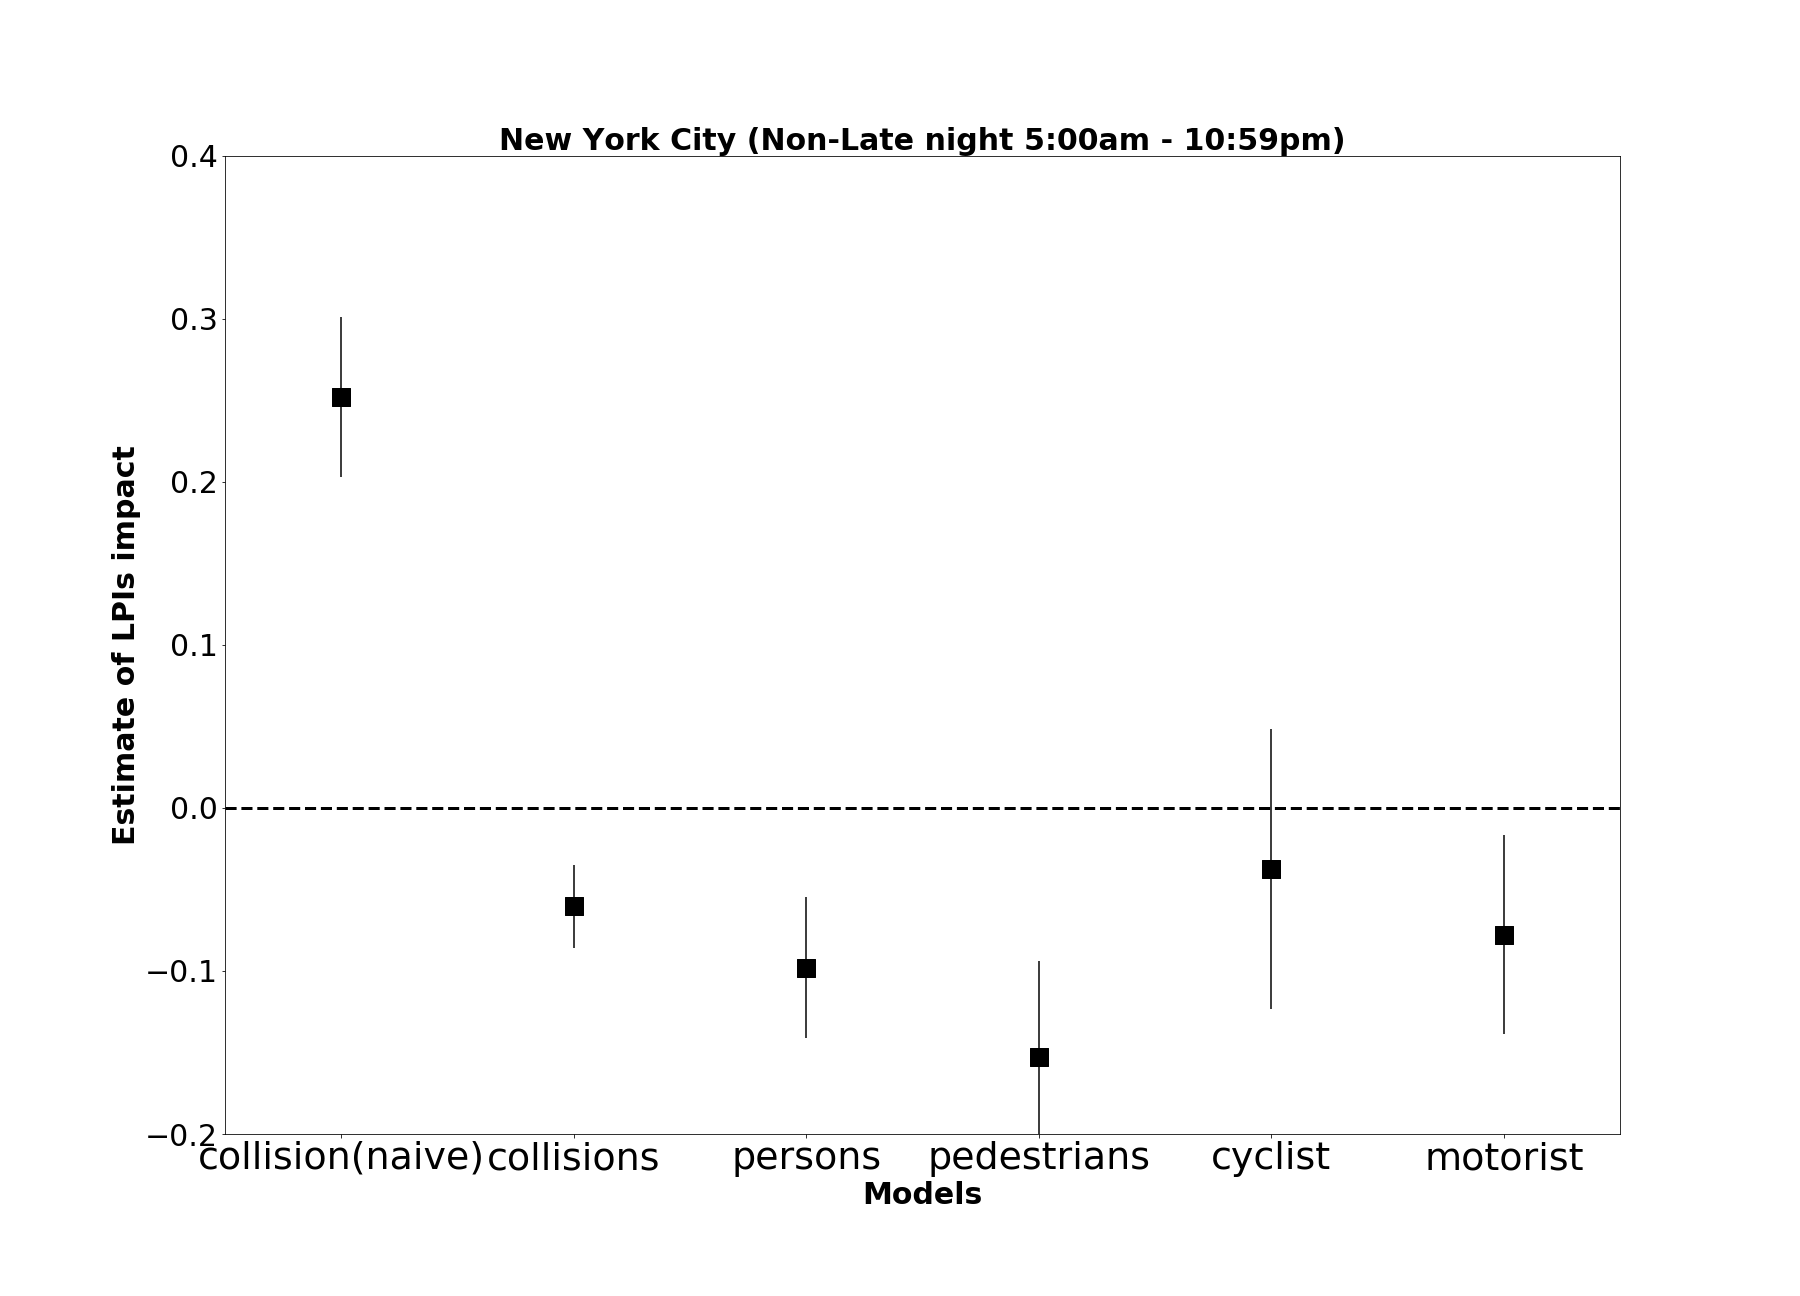
NYC Fixed Effects DiD (Non-late night)
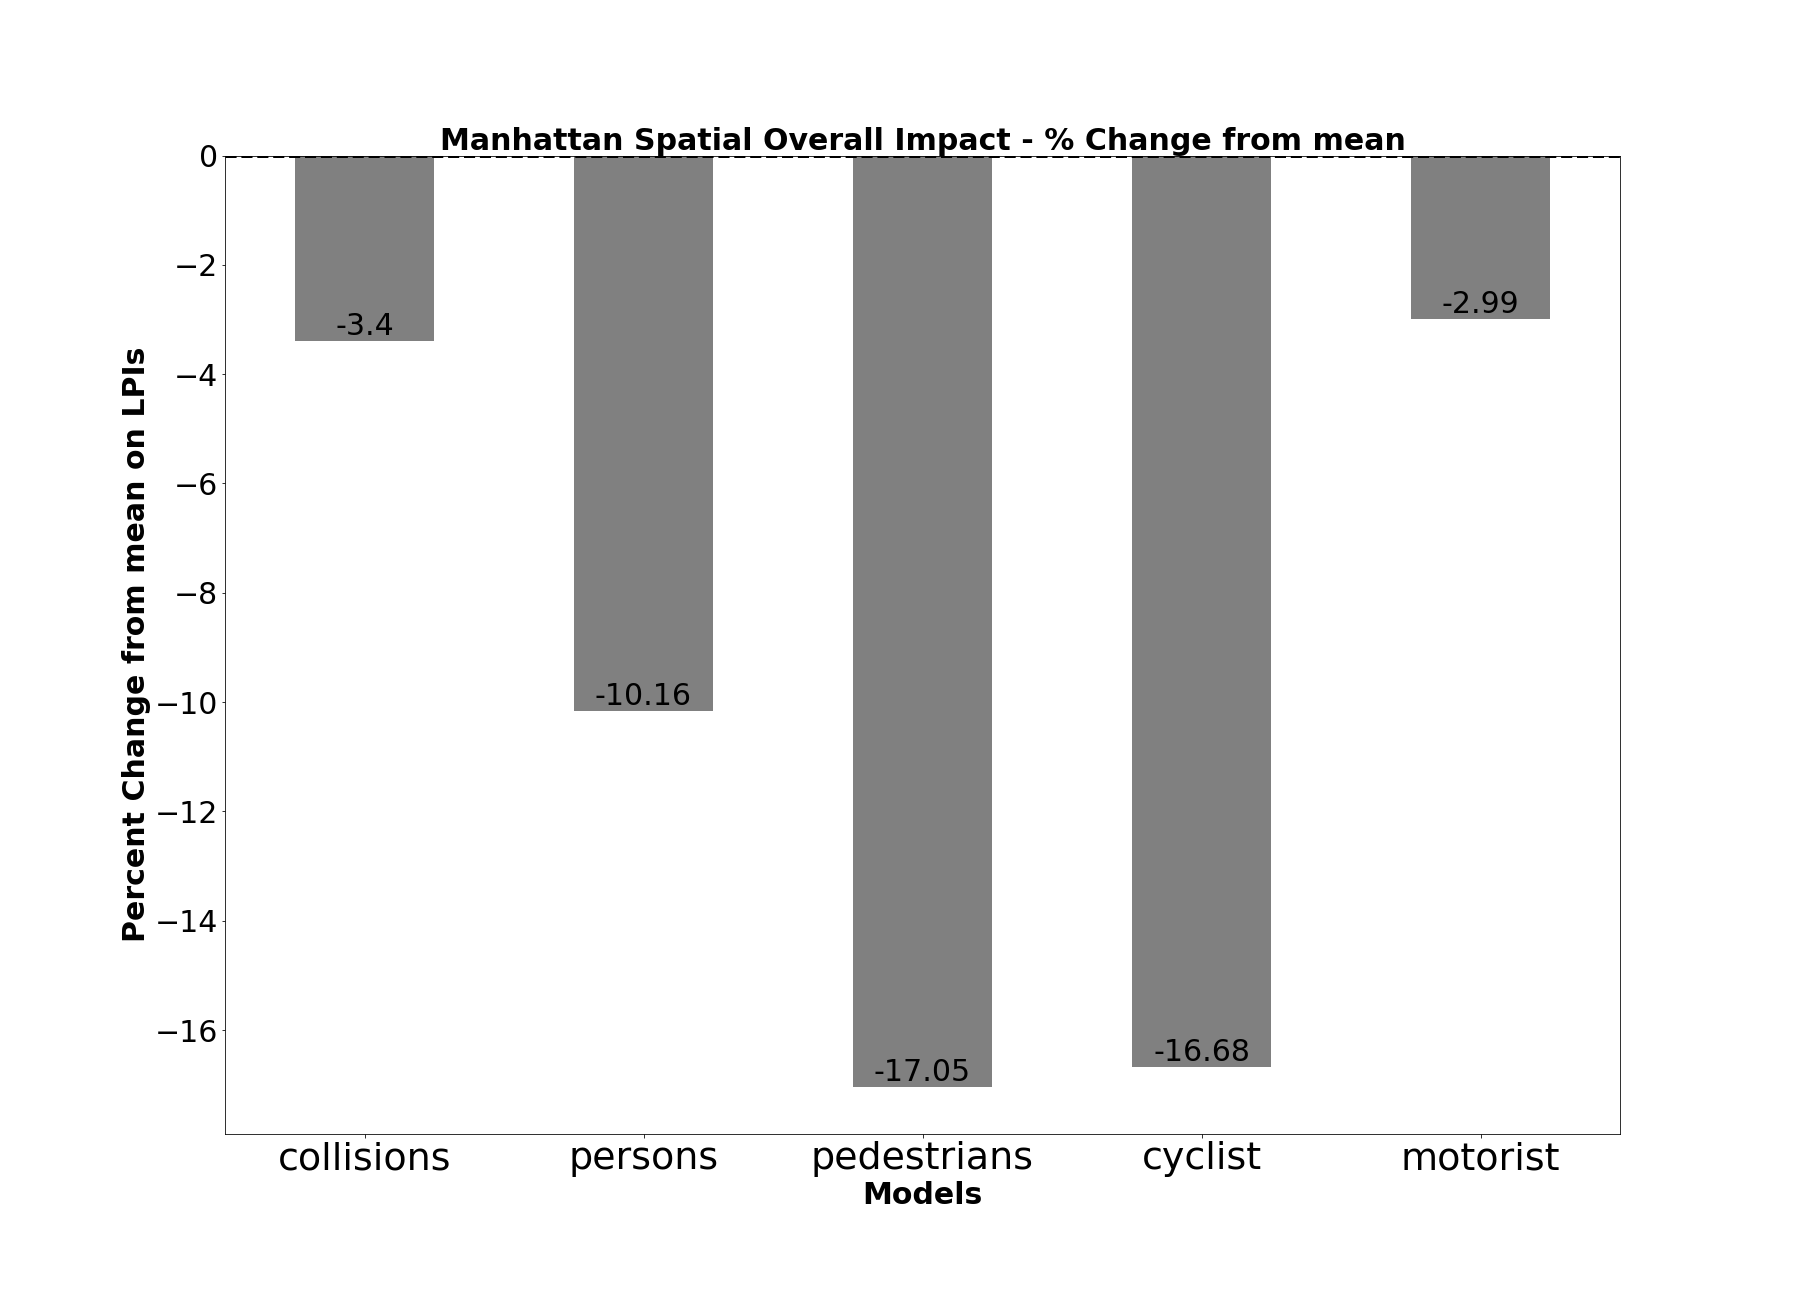
Spatial Lagged Overall Impact Fixed Effects DiD (Manhattan)
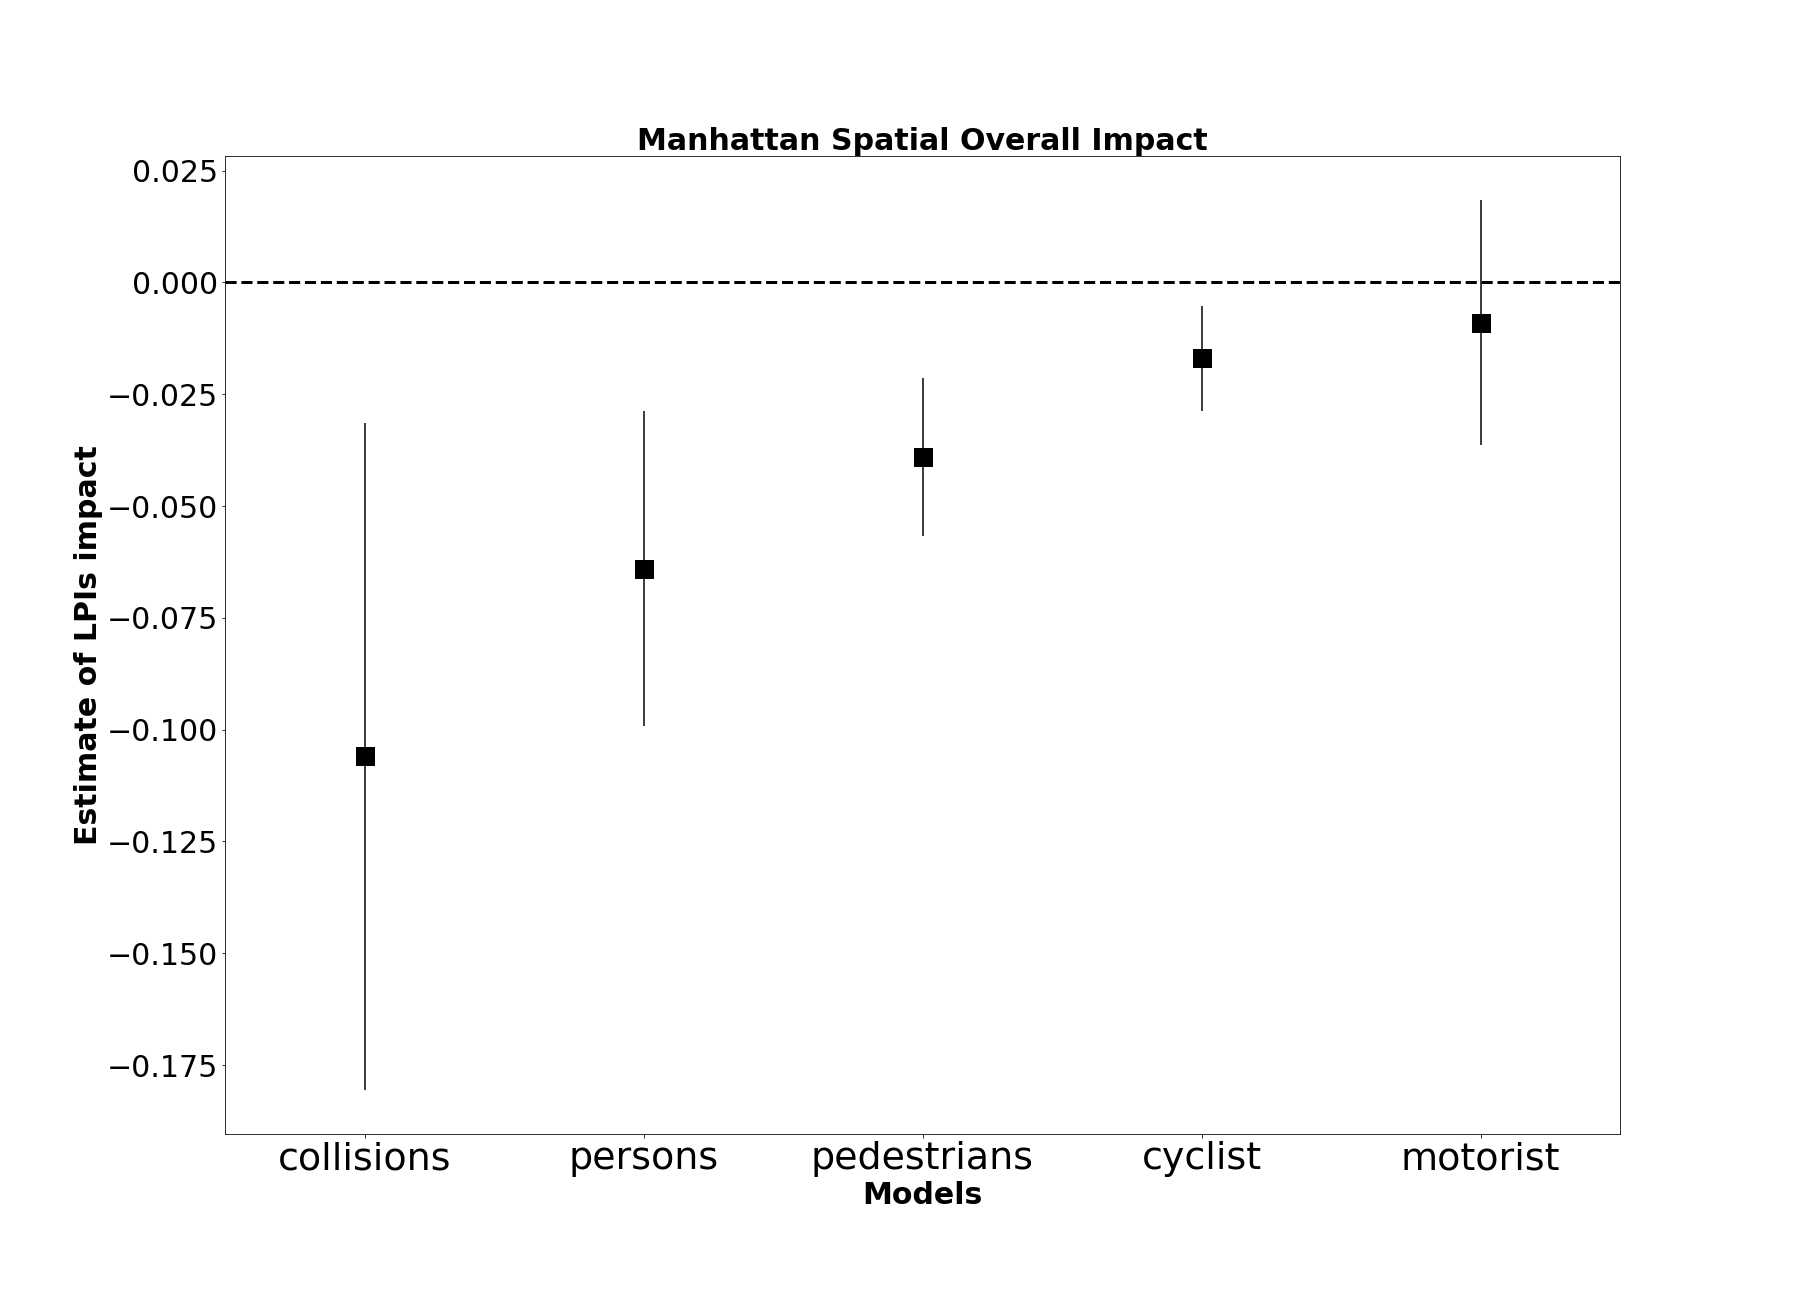
Spatial Lagged Overall Impact Fixed Effects DiD (Manhattan)
Tables and Figures
Table 1: Collisions counts and averages
| Categories | 2012 | 2013 | 2014 | 2015 | 2016 | 2017 | 2018 |
|---|---|---|---|---|---|---|---|
| A. Collision/Injuries outcomes at Intersections | |||||||
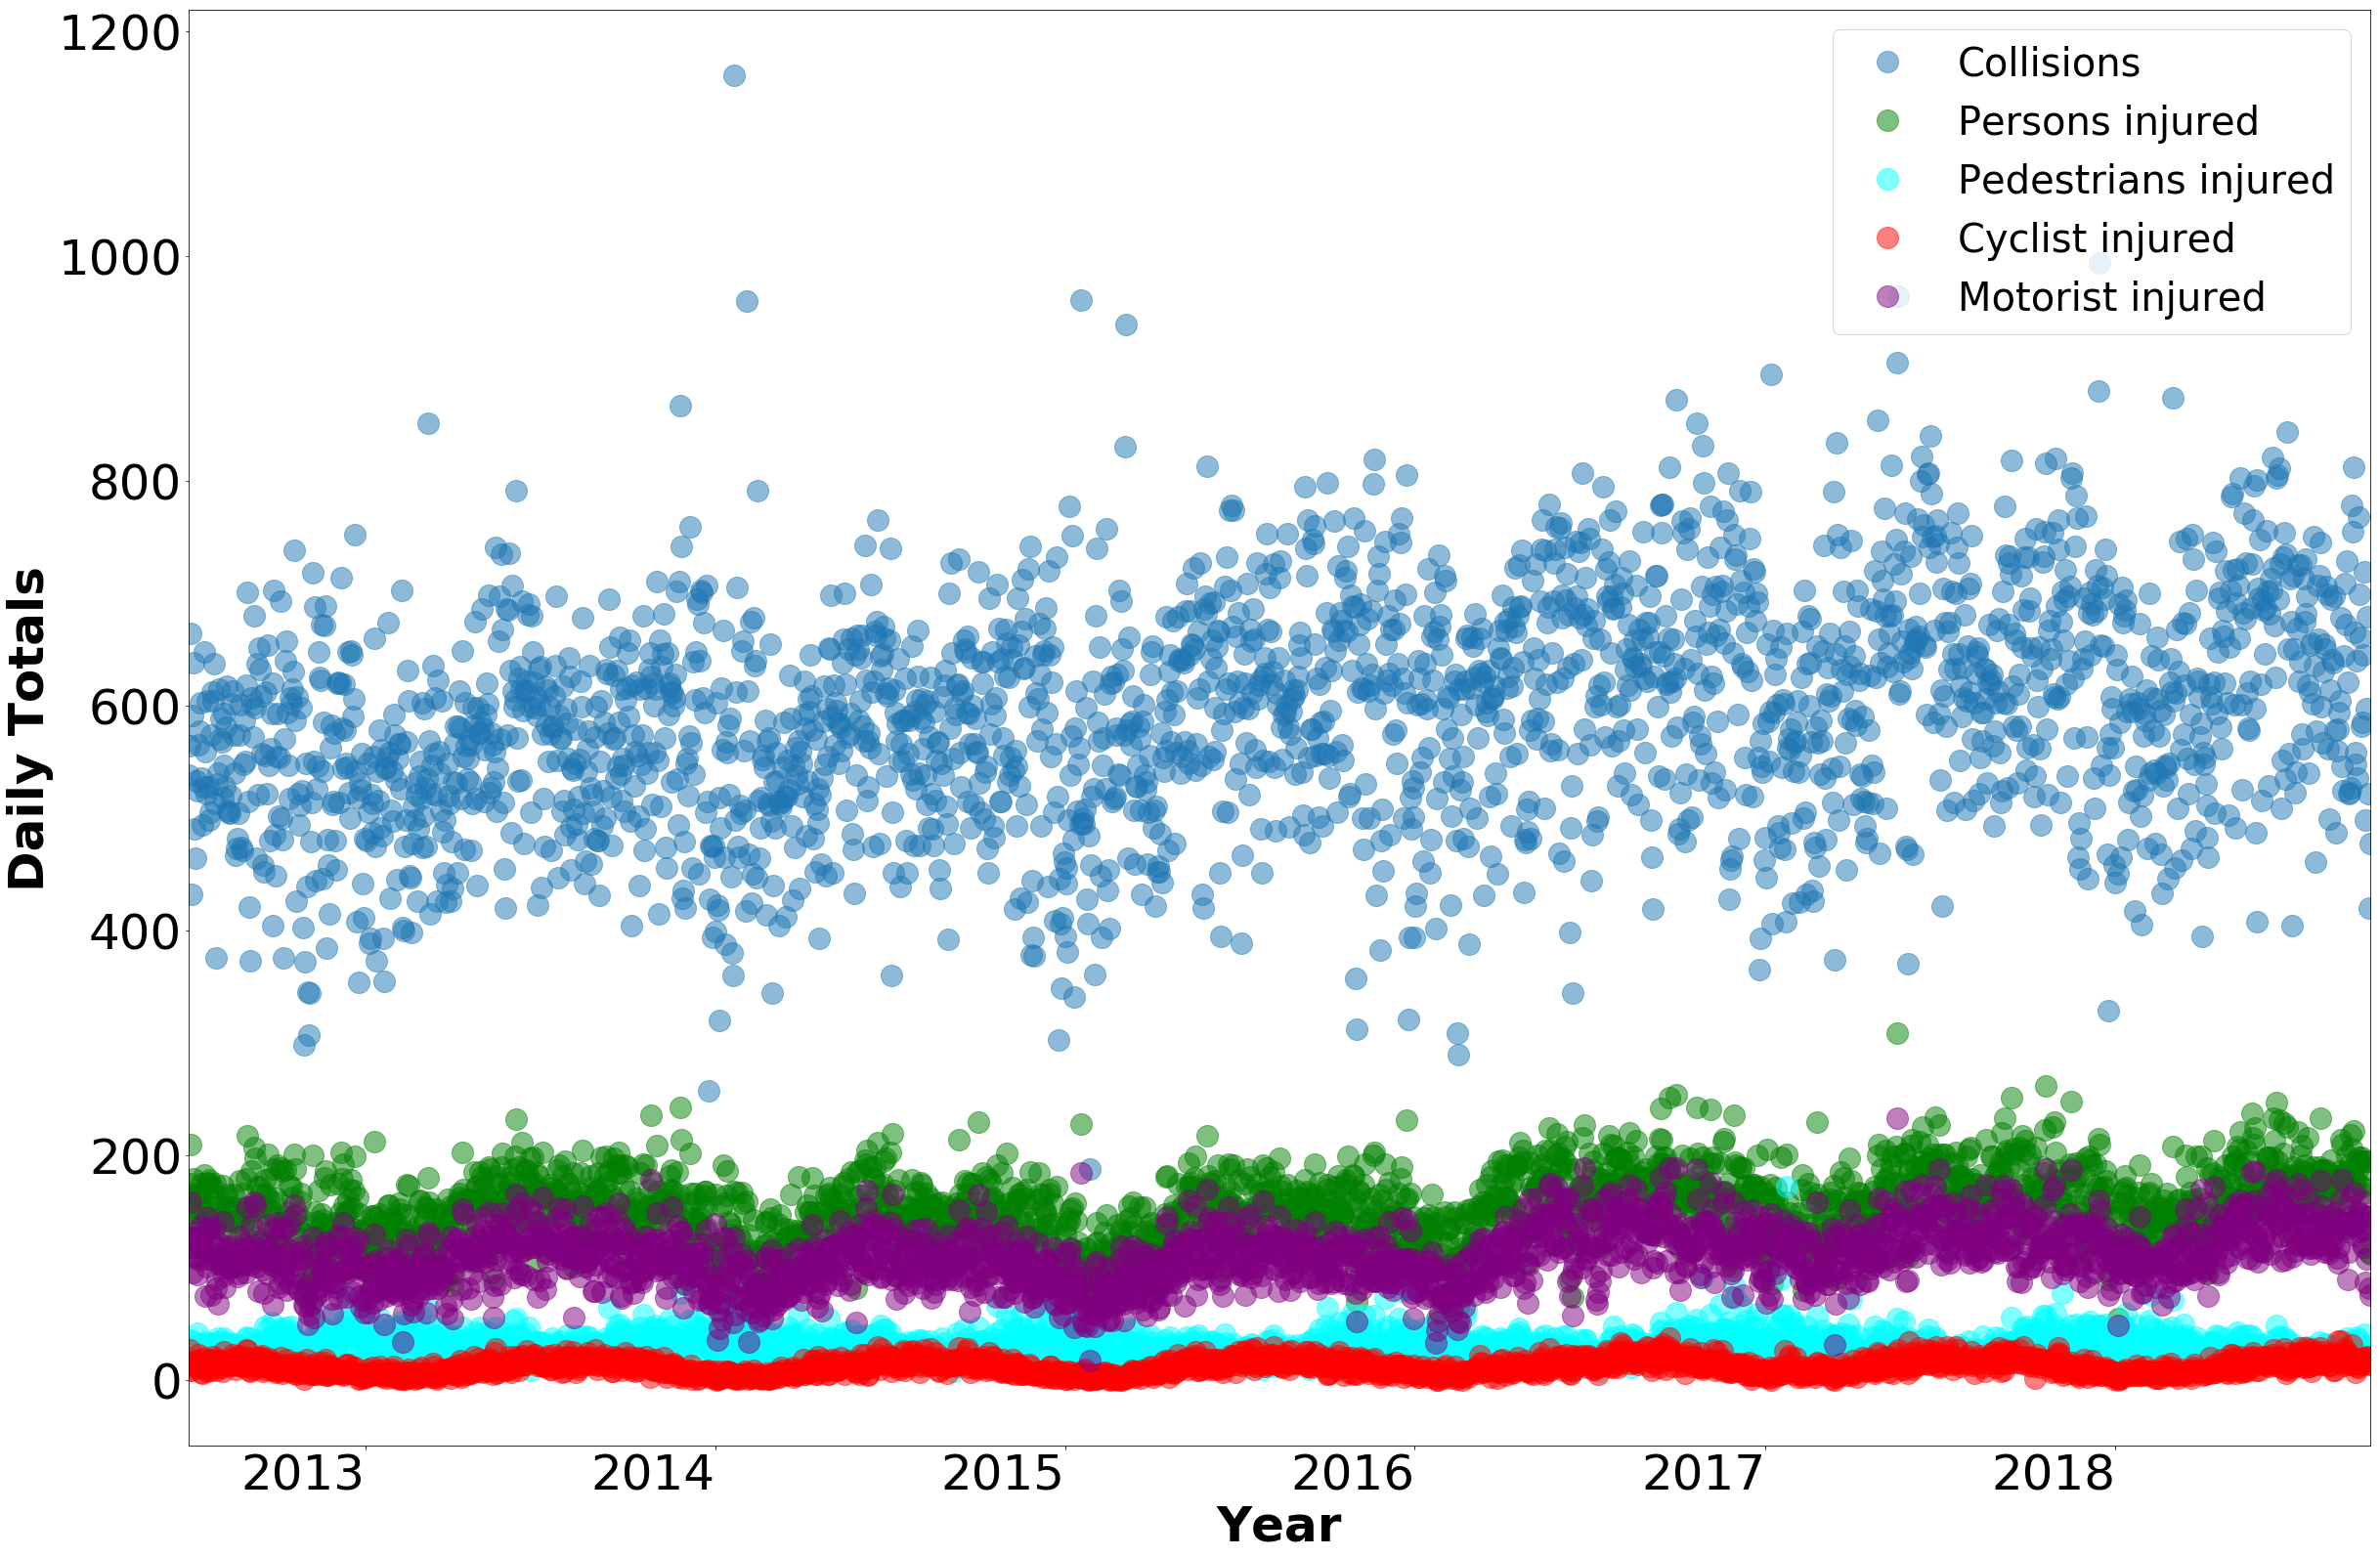
| Collisions | 47,611 | 95,437 | 94,644 | 97,792 | 68,511 | 78,764 | 58,942 |
| Injuries of: | |||||||
| Persons | 13,336 | 26,640 | 24,466 | 23,160 | 18,611 | 22,666 | 17,513 |
| Pedestrians | 3,725 | 7,555 | 6,859 | 6,095 | 4,821 | 5,781 | 3,942 |
| Cyclist | 1,355 | 2,569 | 2,598 | 2,597 | 1,978 | 2,339 | 1,766 |
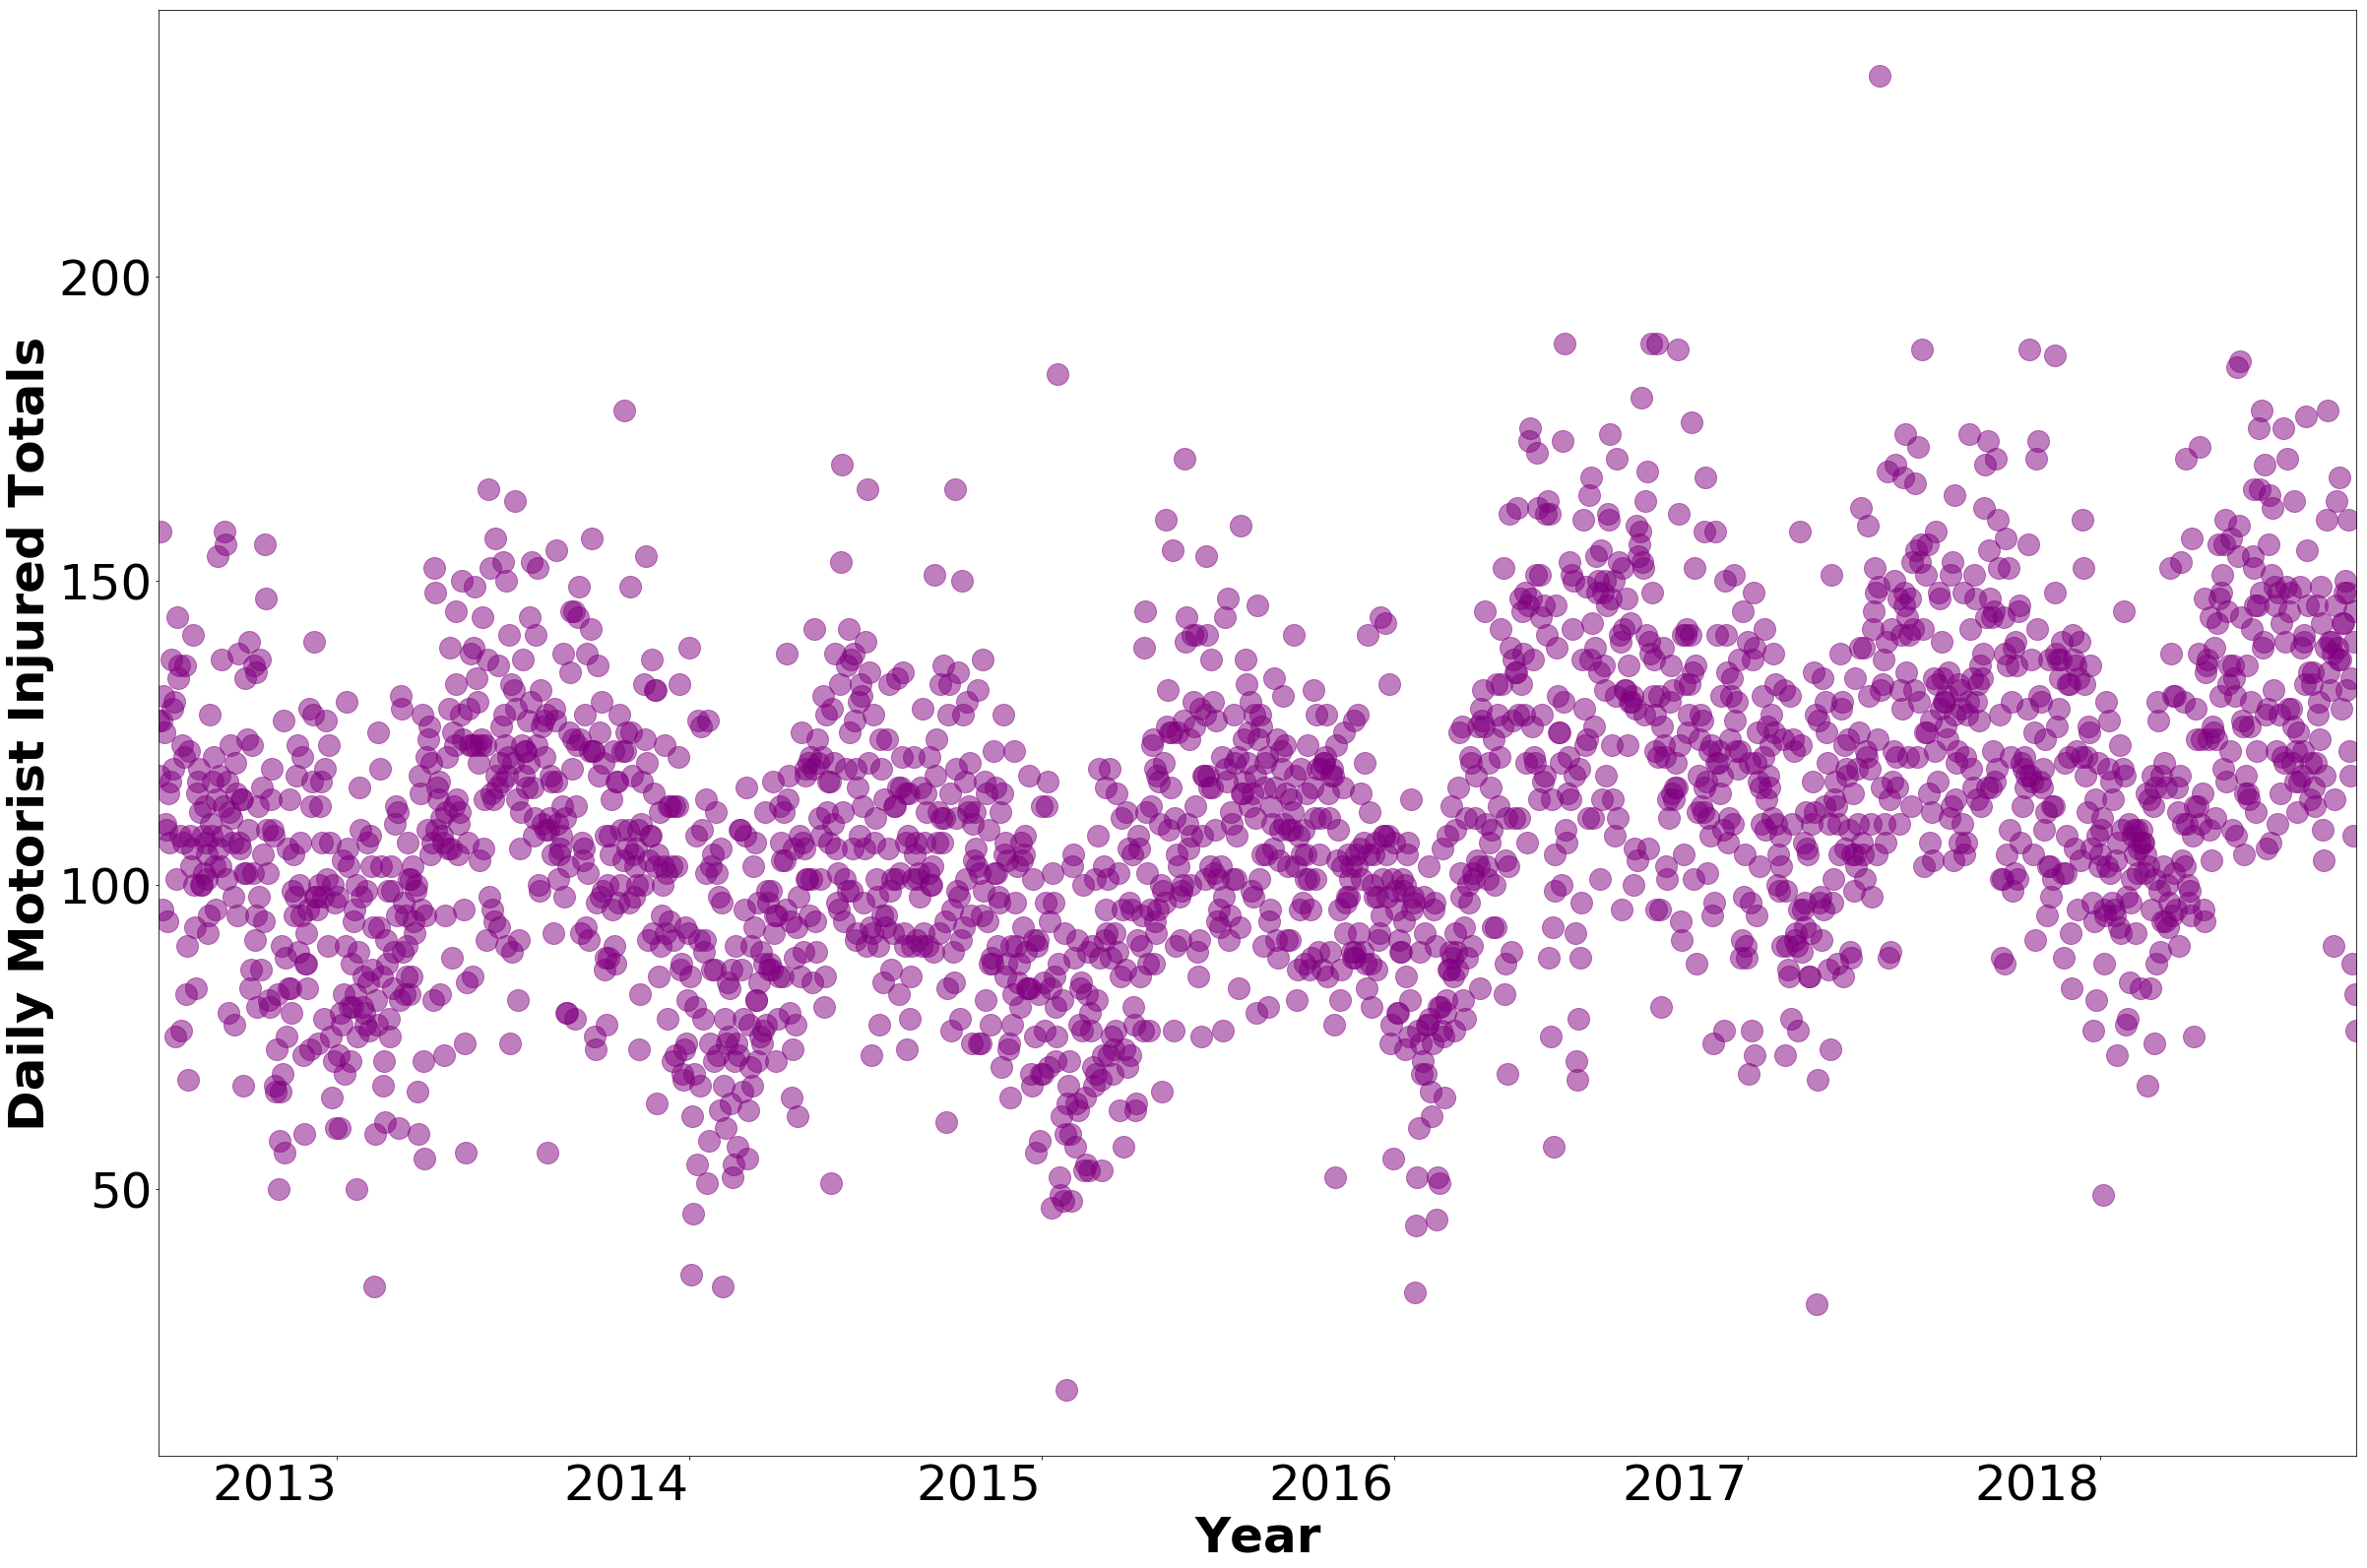
| Motorist | 8,250 | 16,516 | 15,008 | 14,468 | 11,911 | 14,967 | 11,706 |
| B. Collision/Injuries counts at Intersections Stratified by LPIs | |||||||
| LPIs Ever == 1 | 13,068 | 26,101 | 25,963 | 27,244 | 18,588 | 20,173 | 15,034 |
| LPIs Ever == 0 | 34,543 | 69,336 | 68,681 | 70,548 | 49,923 | 58,591 | 43,908 |
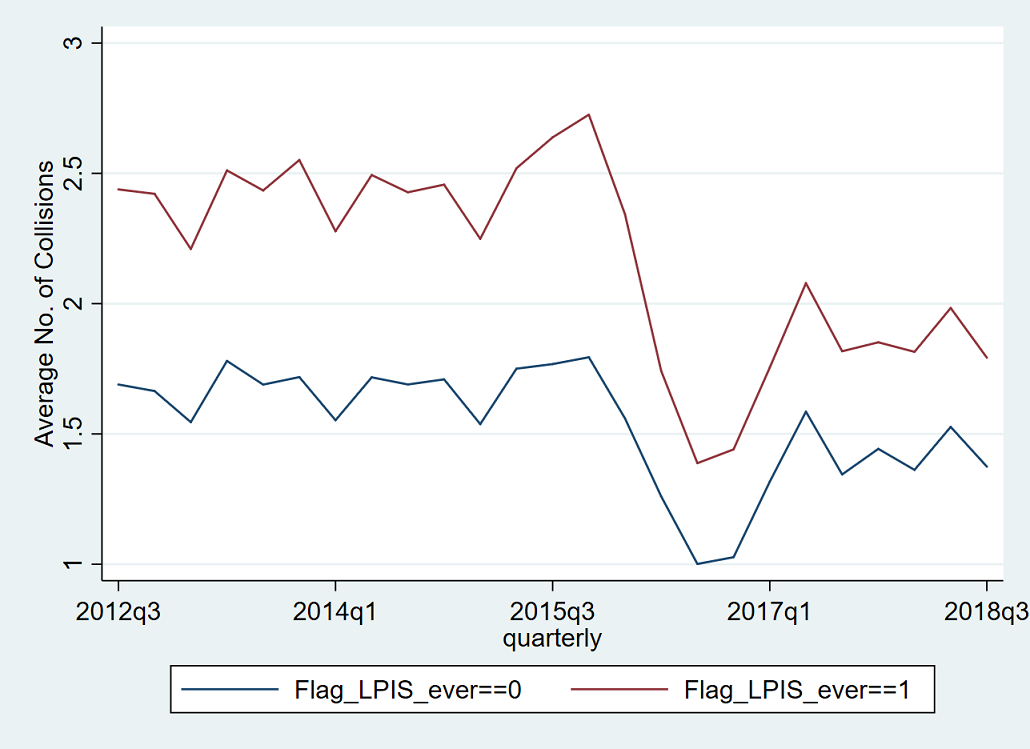
| C. Collision/Injuries averages at Intersections Stratified by LPIs | |||||||
| LPIs Ever == 1 | 2.43 | 2.43 | 2.41 | 2.53 | 1.73 | 1.88 | 1.86 |
| LPIs Ever == 0 | 1.68 | 1.68 | 1.67 | 1.71 | 1.21 | 1.42 | 1.42 |
Table 2: Collisions with longitude and latitude filled
| 2012 | 2013 | 2014 | 2015 | 2016 | 2017 | 2018 | |
|---|---|---|---|---|---|---|---|
| Coordinates Filled | 85,452 | 171,917 | 172,730 | 182,958 | 162,745 | 214,935 | 157,185 |
| (%) | -84.99 | -84.39 | -83.84 | -84.05 | -71.44 | -93.75 | -94.87 |
| Coordinates missing | 15,087 | 31,806 | 33,296 | 34,729 | 65,077 | 14,327 | 8,508 |
| (%) | -15.01 | -15.61 | -16.16 | -15.95 | -28.56 | -6.25 | -5.13 |
| Total | 0 | 13 | 60 | 408 | 713 | 825 | 670 |
Table 3: Number of LPIs implemented in Quarters and Years
| 2012 | 2013 | 2014 | 2015 | 2016 | 2017 | 2018 | |
|---|---|---|---|---|---|---|---|
| Coordinates Filled | 85,452 | 171,917 | 172,730 | 182,958 | 162,745 | 214,935 | 157,185 |
| (%) | -84.99 | -84.39 | -83.84 | -84.05 | -71.44 | -93.75 | -94.87 |
| Coordinates missing | 15,087 | 31,806 | 33,296 | 34,729 | 65,077 | 14,327 | 8,508 |
| (%) | -15.01 | -15.61 | -16.16 | -15.95 | -28.56 | -6.25 | -5.13 |
| Total | 0 | 13 | 60 | 408 | 713 | 825 | 670 |
Table 4: Characteristics of the intersections
| LPIs intersections | Control intersections | |
|---|---|---|
| No. of intersections in New York City | 2,689 | 10,298 |
| School (intersections within 200 feet of school) | 201 | 475 |
| -7.47% | -4.61% | |
| Seniors (intersections within safe senior zone) |
859 | 1,717 |
| -31.94% | -16.67% | |
| Priority Intersection (intersections within 10 ft of signal intersection) | 110 | 109 |
| -4.09% | -1.06% |
Table 5: Naive regression model - Number of collisions per quarter
| 1 | 2 | 3 | 4 | 5 | 6 | |
|---|---|---|---|---|---|---|
| VARIABLES | Poisson | OLS | Poisson Late night | OLS Late night | Poisson Non- Late night | OLS Non- Late night |
| Flag LPIs | 0.258*** | 0.447*** | 0.309*** | 0.0568*** | 0.252*** | 0.390*** |
| -0.0253 | -0.047 | -0.0383 | -0.00769 | -0.025 | -0.0415 | |
| Bike route | 0.239*** | 0.421*** | 0.362*** | 0.0644*** | 0.226*** | 0.357*** |
| -0.0219 | -0.0412 | -0.0301 | -0.00594 | -0.0216 | -0.0363 | |
| Street Improvement | 0.334*** | 0.707*** | 0.357*** | 0.0772*** | 0.332*** | 0.630*** |
| -0.0737 | -0.182 | -0.089 | -0.0224 | -0.0738 | -0.164 | |
| Left Turn | 0.519*** | 1.186*** | 0.449*** | 0.106*** | 0.527*** | 1.080*** |
| -0.0608 | -0.176 | -0.11 | -0.0327 | -0.0587 | -0.152 | |
| Observations | 324,675 | 324,675 | 324,675 | 324,675 | 324,675 | 324,675 |
Table 6: Fixed effect DiD model - Number of collisions per quarter
| 1 | 2 | 3 | 4 | 5 | 6 | |
|---|---|---|---|---|---|---|
| VARIABLES | Fixed effects poisson |
Fixed effects regression |
Fixed effects poisson Late night |
Fixed effects regression Late night |
Fixed effects poisson Non-Late night |
Fixed effects regression Non-Late night |
| Flag LPIs | -0.0545*** | -0.162*** | -0.00245 | -0.00039 | -0.0604*** | -0.161*** |
| -0.0128 | -0.0305 | -0.0255 | -0.00628 | -0.013 | -0.0279 | |
| Bike route | 0.0233 | 0.0521 | 0.0421 | 0.0101 | 0.0217 | 0.0434 |
| -0.0189 | -0.0379 | -0.04 | -0.00865 | -0.0189 | -0.0345 | |
| Street Improvement | -0.0157 | -0.209 | -0.0133 | -0.016 | -0.0172 | -0.195 |
| -0.0449 | -0.148 | -0.0661 | -0.0234 | -0.0458 | -0.135 | |
| Left Turn | -0.140*** | -0.806*** | -0.133* | -0.0683** | -0.139*** | -0.742*** |
| -0.0369 | -0.174 | -0.0741 | -0.0274 | -0.0384 | -0.162 | |
| Observations | 283,550 | 283,550 | 242,725 | 242,725 | 283,200 | 283,200 |
| Number of intersection_id | 11,342 | 11,342 | 9,709 | 9,709 | 11,328 | 11,328 |
| Number of intersection_id | 11,342 | 11,342 | 9,709 | 9,709 | 11,328 | 11,328 |
Table 7: Fixed effect DiD model - Number of persons injured per quarter
| 1 | 2 | 3 | 4 | 5 | 6 | |
|---|---|---|---|---|---|---|
| VARIABLES | Fixed effects poisson |
Fixed effects regression |
Fixed effects poisson Late night |
Fixed effects regression Late night |
Fixed effects poisson Non-Late night |
Fixed effects regression Non-Late night |
| Flag LPIs | -0.0993*** | -0.0692*** | -0.111** | -0.0145** | -0.0980*** | -0.0603*** |
| -0.0213 | -0.0134 | -0.054 | -0.00722 | -0.0221 | -0.0122 | |
| Bike route | 0.0169 | 0.01 | -0.00445 | -0.000199 | 0.0193 | 0.0103 |
| -0.0307 | -0.0166 | -0.0789 | -0.00986 | -0.0316 | -0.015 | |
| Street Improvement | -0.0272 | -0.041 | -0.106 | -0.0187 | -0.0167 | -0.0287 |
| -0.0545 | -0.0434 | -0.17 | -0.028 | -0.0557 | -0.0388 | |
| Left Turn | -0.200*** | -0.217*** | -0.25 | -0.0483* | -0.193*** | -0.185*** |
| -0.066 | -0.0623 | -0.156 | -0.0272 | -0.0675 | -0.0552 | |
| Observations | 273,875 | 273,875 | 146,725 | 146,725 | 272,000 | 272,000 |
| Number of intersection_id | 10,955 | 10,955 | 5,869 | 5,869 | 10,880 | 10,880 |
| Number of intersection_id | 11,342 | 11,342 | 9,709 | 9,709 | 11,328 | 11,328 |
Table 8: Fixed effect DiD model - Number of pedestrians injured per quarter
| 1 | 2 | 3 | 4 | 5 | 6 | |
|---|---|---|---|---|---|---|
| VARIABLES | Fixed effects poisson |
Fixed effects regression |
Fixed effects poisson Late night |
Fixed effects regression Late night |
Fixed effects poisson Non-Late night |
Fixed effects regression Non-Late night |
| Flag LPIs | -0.147*** | -0.0337*** | -0.0895 | -0.00493 | -0.153*** | -0.0329*** |
| -0.0289 | -0.00569 | -0.088 | -0.00529 | -0.0303 | -0.00547 | |
| Bike route | -0.0789* | -0.0129* | -0.0592 | -0.00251 | -0.0799* | -0.0123* |
| -0.0419 | -0.00749 | -0.131 | -0.00773 | -0.0445 | -0.00741 | |
| Street Improvement | -0.0391 | -0.0208 | -0.125 | -0.00877 | -0.0312 | -0.0168 |
| -0.0744 | -0.0194 | -0.236 | -0.0159 | -0.0849 | -0.02 | |
| Left Turn | -0.302*** | -0.147*** | -0.199 | -0.0198 | -0.311*** | -0.136*** |
| -0.0718 | -0.0264 | -0.204 | -0.0148 | -0.0804 | -0.0259 | |
| Observations | 223,100 | 223,100 | 58,475 | 58,475 | 218,675 | 218,675 |
| Number of intersection_id | 8,924 | 8,924 | 2,339 | 2,339 | 8,747 | 8,747 |
| Number of intersection_id | 11,342 | 11,342 | 9,709 | 9,709 | 11,328 | 11,328 |
Table 9: Fixed effect DiD model - Number of cyclists injured per quarter
| 1 | 2 | 3 | 4 | 5 | 6 | |
|---|---|---|---|---|---|---|
| VARIABLES | Fixed effects poisson |
Fixed effects regression |
Fixed effects poisson Late night |
Fixed effects regression Late night |
Fixed effects poisson Non-Late night |
Fixed effects regression Non-Late night |
| Flag LPIs | -0.0272 | -0.00275 | 0.0632 | 0.00269 | -0.0376 | -0.00357 |
| -0.0418 | -0.00431 | -0.13 | -0.00617 | -0.0437 | -0.00423 | |
| Bike route | 0.172*** | 0.0157*** | 0.0532 | 0.00229 | 0.184*** | 0.0161*** |
| -0.0643 | -0.00585 | -0.204 | -0.00951 | -0.0677 | -0.00584 | |
| Street Improvement | 0.0935 | 0.00912 | 0.252 | 0.0121 | 0.0788 | 0.00728 |
| -0.116 | -0.0125 | -0.33 | -0.0163 | -0.124 | -0.0125 | |
| Left Turn | -0.206* | -0.0309* | -0.291 | -0.0155 | -0.199 | -0.0272* |
| -0.122 | -0.0158 | -0.339 | -0.0186 | -0.133 | -0.0158 | |
| Observations | 158,275 | 158,275 | 27,575 | 27,575 | 152,775 | 152,775 |
| Number of intersection_id | 6,331 | 6,331 | 1,103 | 1,103 | 6,111 | 6,111 |
| Number of intersection_id | 11,342 | 11,342 | 9,709 | 9,709 | 11,328 | 11,328 |
Table 10: Fixed effect DiD model - Number of motorists injured per quarter
| 1 | 2 | 3 | 4 | 5 | 6 | |
|---|---|---|---|---|---|---|
| VARIABLES | Fixed effects poisson |
Fixed effects regression |
Fixed effects poisson Late night |
Fixed effects regression Late night |
Fixed effects poisson Non-Late night |
Fixed effects regression Non-Late night |
| Flag LPIs | -0.0856*** | -0.0362*** | -0.129* | -0.0163* | -0.0778** | -0.0284*** |
| -0.029 | -0.0119 | -0.0676 | -0.0084 | -0.0311 | -0.0109 | |
| Bike route | 0.0359 | 0.013 | 0.00446 | 0.000949 | 0.0399 | 0.0127 |
| -0.0419 | -0.0149 | -0.0974 | -0.0118 | -0.044 | -0.0136 | |
| Street Improvement | -0.0357 | -0.0271 | -0.12 | -0.0172 | -0.0216 | -0.0171 |
| -0.0751 | -0.0389 | -0.219 | -0.0322 | -0.0758 | -0.0337 | |
| Left Turn | -0.0792 | -0.0408 | -0.216 | -0.0319 | -0.0525 | -0.0236 |
| -0.103 | -0.0518 | -0.217 | -0.03 | -0.107 | -0.0461 | |
| Observations | 254,400 | 254,400 | 113,775 | 113,775 | 248,025 | 248,025 |
| Number of intersection_id | 10,176 | 10,176 | 4,551 | 4,551 | 9,921 | 9,921 |
| Number of intersection_id | 11,342 | 11,342 | 9,709 | 9,709 | 11,328 | 11,328 |
Table 11: Fixed effects DiD Spatial Lag Model of Manhattan Intersections
| 1 | 2 | 3 | 4 | 5 | |
|---|---|---|---|---|---|
| VARIABLES | Number of Collisions | Number of Person injured | Number of Pedestrians injured | Number of Cyclists injured | Number of Motorist Injured |
Flag LPIs |
-0.106*** | -0.0643*** | -0.0389*** | -0.0166*** | -0.00897 |
| -0.0377 | -0.0176 | -0.00894 | -0.00569 | -0.0137 | |
| W.outcome | 0.188*** | 0.0171** | 0.00064 | 0.0320*** | 0.0134* |
| -0.00628 | -0.00709 | -0.00714 | -0.00705 | -0.00713 | |
| Impact | |||||
| Direct | -0.106*** | -0.064*** | -0.039*** | -0.017*** | -0.009 |
| 0.038 | 0.018 | 0.009 | 0.006 | 0.014 | |
| Indirect | -0.022*** | -0.001** | 0 | -0.001** | 0 |
| 0.008 | 0.001 | 0 | 0 | 0 | |
| Total | -0.128*** | -0.065*** | -0.039*** | -0.017*** | -0.009 |
| 0.046 | 0.018 | 0.009 | 0.006 | 0.014 | |
| Observations | 68,400 | 68,400 | 68,400 | 68,400 | 68,400 |
| Number of intersection_id | 2,736 | 2,736 | 2,736 | 2,736 | 2,736 |
Table 12: Fixed effects DiD Spatial Error Model of Manhattan Intersections
| 1 | 2 | 3 | 4 | 5 | |
|---|---|---|---|---|---|
| VARIABLES | Number of Collisions | Number of Person injured | Number of Pedestrians injured | Number of Cyclists injured | Number of Motorist Injured |
| Flag LPIs | -0.129*** | -0.0644*** | -0.0389*** | -0.0168*** | -0.00893 |
| -0.0387 | -0.0176 | -0.00894 | -0.00572 | -0.0138 | |
| e.outcome | 0.188*** | 0.0150** | -0.00143 | 0.0319*** | 0.0129* |
| -0.00639 | -0.00713 | -0.00718 | -0.00707 | -0.00714 | |
| Observations | 68,400 | 68,400 | 68,400 | 68,400 | 68,400 |
| Number of intersection_id | 2,736 | 2,736 | 2,736 | 2,736 | 2,736 |
Table 13: Fixed effects DiD Non-Spatial Model of Manhattan Intersections
| 1 | 2 | 3 | 4 | 5 | |
|---|---|---|---|---|---|
| VARIABLES | Number of Collisions | Number of Person injured | Number of Pedestrians injured | Number of Cyclists injured | Number of Motorist Injured |
| 1.flag_LPIS | -0.089 | -0.0644*** | -0.0389*** | -0.0166** | -0.00906 |
| -0.0679 | -0.0208 | -0.0109 | -0.00662 | -0.0153 | |
| bike_route_tv | 0.177** | 0.0265 | -0.011 | 0.00352 | 0.0361* |
| -0.088 | -0.025 | -0.0128 | -0.00735 | -0.0189 | |
| flag_street_improv | -0.453 | -0.0712 | -0.0457 | 0.00515 | -0.0297 |
| -0.301 | -0.0638 | -0.0301 | -0.0198 | -0.0461 | |
| flag_left_turn | -0.999*** | -0.291*** | -0.168*** | -0.0284 | -0.0966 |
| -0.328 | -0.0924 | -0.0494 | -0.025 | -0.0604 | |
| Observations | 68400 | 68400 | 68400 | 68400 | 68400 |
| R-squared | 0.089 | 0.016 | 0.015 | 0.01 | 0.006 |
| Number of _ID | 2736 | 2736 | 2736 | 2736 | 2736 |
References
Ajilore, O. (2015). Identifying peer effects using spatial analysis: the role of peers on risky sexual behavior. Review of Economics of the Household, 13(3), 635–652. https://doi.org/10.1007/s11150-013-9235-4
Anselin, L. (1988). Spatial Econometrics: Methods and Models. In Studies in Operational Regional Science. Retrieved from https://www.springer.com/us/book/9789024737352
Anselin, L., & Griffith, D. A. (1988). Do spatial effects really matter in regression analysis? Papers - Regional Science Association, 65, 11–34.
Appendix A - Crash Cost Estimates by Maximum Police-Reported Injury Severity Within Selected Crash Geometries, October 2005 - FHWA-HRT-05-051. (n.d.). Retrieved March 16, 2019, from https://www.fhwa.dot.gov/publications/research/safety/05051/06.cfm
Fayish, A., & Gross, F. (2010). Safety Effectiveness of Leading Pedestrian Intervals Evaluated by a Before-After Study with Comparison Groups. Transportation Research Record: Journal of the Transportation Research Board, 2198, 15–22. https://doi.org/10.3141/2198-03
Goodman-Bacon, A. (2018). Difference-in-Differences with Variation in Treatment Timing (No. w25018). https://doi.org/10.3386/w25018
Goughnour, E., Carter, D., Lyon, C., Persaud, B., Lan, B., Chun, P., … Signor, K. (2018). Safety Evaluation of Protected Left-Turn Phasing and Leading Pedestrian Intervals on Pedestrian Safety (No. FHWA-HRT-18-044). U.S. Department of Transportation.
Goughnour, Elissa, Carter, D., Lyon, C., Persaud, B., Lan, B., Chun, P., … Signor, K. (n.d.). Safety Evaluation of Protected Left-Turn Phasing and Leading Pedestrian Intervals on Pedestrian Safety. Retrieved from https://www.fhwa.dot.gov/publications/research/safety/18044/18044.pdf
Hauer, E., Harwood, D. W., Council, F. M., & Griffith, M. S. (2002). Estimating Safety by the Empirical Bayes Method: A Tutorial. Transportation Research Record: Journal of the Transportation Research Board, 1784(1), 126–131. https://doi.org/10.3141/1784-16
Hubbard, S. M. L., Bullock, D. M., & Thai, J. H. (2008). Trial Implementation of a Leading Pedestrian Interval: Lessons Learned. ITE Journal, 78(10). Retrieved from https://trid.trb.org/view/873717
King, M. R. (2000). CALMING NEW YORK CITY INTERSECTIONS. Transportation Research Circular. Presented at the Urban Street Symposium Transportation Research Board; American Association of State Highway and Transportation Officials; American Society of Civil Engineers; Federal Highway Administration; Institute of Transportation Engineers; and National Association of County Engineers. Retrieved from https://trid.trb.org/view/686665
LeSage, J., Pace, R. K., & Pace, R. K. (2009). Introduction to Spatial Econometrics. https://doi.org/10.1201/9781420064254
Matyas, L., & Sevestre, P. (Eds.). (2008). The Econometrics of Panel Data: Fundamentals and Recent Developments in Theory and Practice (3rd ed.). In (3rd ed.). Retrieved from https://www.springer.com/us/book/9783540758891
NYC DOT. (2014). Vision Zero Action Plan 2014. Retrieved from http://www.nyc.gov/html/visionzero/pdf/nyc-vision-zero-action-plan.pdf
NYC DOT. (n.d.). NYC DOT - Data Feeds. Retrieved February 20, 2019, from https://www1.nyc.gov/html/dot/html/about/datafeeds.shtml
NYC DOT - Leading Pedestrian Interval Signals. (n.d.). Retrieved December 17, 2018, from http://www.nyc.gov/html/dot/html/infrastructure/leading-ped-intervals.shtml
NYC Open Data, O. (2018, December 2). NYPD Motor Vehicle Collisions | NYC Open Data. Retrieved December 2, 2018, from /Public-Safety/NYPD-Motor-Vehicle-Collisions/h9gi-nx95, /Public-Safety/NYPD-Motor-Vehicle-Collisions/h9gi-nx95
NYS DMV. (n.d.). Motorist accident reports | New York State Department of Motor Vehicles. Retrieved February 20, 2019, from https://dmv.ny.gov/dmv-records/motorist-accident-reports
Open Data Law - DoITT. (2019, February 16). Retrieved February 16, 2019, from https://www1.nyc.gov/site/doitt/initiatives/open-data-law.page
Pécheux, K., Bauer, J., & McLeod, P. (2009). Pedestrian Safety Engineering and ITS-Based Countermeasures Program for Reducing Pedestrian Fatalities, Injury Conflicts, and Other Surrogate Measures Final System Impact Report. Retrieved from Science Applications International Corporation (SAIC) website: https://safety.fhwa.dot.gov/ped_bike/tools_solve/ped_scdproj/sys_impact_rpt/sys_impact_rpt.pdf
Rhee, K.-A., Kim, J.-K., Lee, Y., & Ulfarsson, G. F. (2016). Spatial regression analysis of traffic crashes in Seoul. Accident Analysis & Prevention, 91, 190–199. https://doi.org/10.1016/j.aap.2016.02.023
Sharma, A., Smaglik, E. J., Kothuri, S., Smith, O., Koonce, P., & Huang, T. (2017). Leading pedestrian intervals treating the decision to implement as a marginal benefit–Cost problem. Traffic Signal Systems, Volume 2, 96–104. https://doi.org/10.3141/2620-09
Tchoukanski, I. (n.d.). Thiessen Polygons. Retrieved March 4, 2019, from https://www.ian-ko.com/ET_GeoWizards/UserGuide/thiessenPolygons.htm
Van Houten, R., Retting, R. A., Farmer, C. M., & Van Houten, J. (2000). FIELD EVALUATION OF A LEADING PEDESTRIAN INTERVAL SIGNAL PHASE AT THREE URBAN INTERSECTIONS. Transportation Research Record, (1734). Retrieved from https://trid.trb.org/view/671706
Wing, C., Simon, K., & Bello-Gomez, R. A. (2018). Designing Difference in Difference Studies: Best Practices for Public Health Policy Research. Annual Review of Public Health, 39(1), 453–469. https://doi.org/10.1146/annurev-publhealth-040617-013507